
alextohme
alextohme.com
media, digital, customer experience and marketing
27 posts
Don't wanna be here? Send us removal request.
Last Seen Blogs

studenteats
Food on a University Budget

hamburgirlbulge-images
follow @hamburgirlbulge

sir-hankypants
feel it

hotel-du-lait-neutre
L’hôtel du lait neutre

alphastucco
Untitled
Text
B2B CONTENT TEMPLATE FOR BLUE CHIP BRANDS IN MENA

image credit: David Socha, Utilities partner at Teradata
Generating enough content for an always on PR strategy can be difficult.
This template is for MENA PR managers for multinational clients in the professional services and manufacturing sector. Avoid last minute PR rushes or lengthy pitch times working on content themes.
B2B Content Template for Blue Chip Brands in MENA from Alexandra Tohme
1 note
·
View note
Text
What online consumers want from Coffee brands in the GCC
In many cases the online consumer of an established brand can be quite different to an offline one, and because the market landscape and competition is different - a digital branding exercise should be undertaken to audit the positioning, proposition and product. Small changes or exploiting some market gap can often lead to big results, especially because established firms can scale up efficiently
The F&B industry is a good example of this. A coffee shop with a unique in store concept and staff, on a desirable street surrounded by like minded brands - cannot obviously play on these strengths online. In the Middle East, Zomato and other OTT platforms have successfully dis-intermediated the customer brand relationship; because they understand how the online customer thinks about and categorizes food, from the database structure to the UX.
An F&B brand has to list on Zomato in order to grow awareness and maintain or increase topline revenue, but it is now placed in a list with many other brands that it wouldn't have been next to on the street. The order of food brands on the list frequently changes based on the filters that customers use. When the environment is constantly changing it's difficult to maintain top of mind with the customer.
This de personalization means the coffee shop has to find a way to compete on some other variables, and, adding a further later of complexity; play by the rules of multiple other platforms.
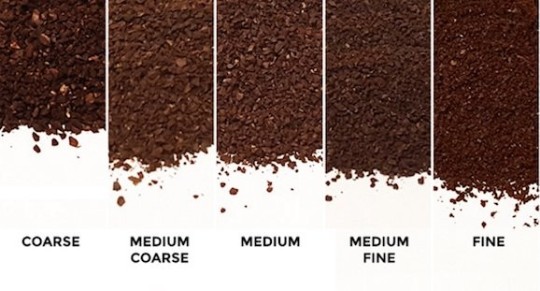
COFFEE MICROMOMENTS
Online Consumers are looking for:
Ubiquitous delivery (often this item isn't offered, or if so, only in certain areas and not at all times)
Unique use cases for delivery - e.g. Coffee being used as a pre workout, therefore people may order to gyms
Unique bundles - coffee and cake, coffee and donut
Special time based offers - combined with innovative advertising. Think the media screens on the Metro platform, and early morning mobile+geo+AR ads
Coffee as a reward for loyalty to the platform (eg Zomato members who are logged in and make $value of monthly purchases can get tailored coffee deals, this also can drive in store footfall)
Late night coffee fixes - suitable for students, opening up a new target market and on campus activations
VERY SAFE WIFI! - (if customer is in store and browsing)
As you can see, there is a translation of the knowledgeable and friendly barista who knows you and your preferences, into the brand voice and values (of customization, ease of use, and friendliness) across multiple touchpoints.
If the brand has enough resources to iterate quickly, they can quickly become a category leader online.
2 notes
·
View notes
Text
How your ad strategy can mitigate against volatility in media rates

Get better ROI from your digital channels
Investing in more creative assets can insulate you from volatility in the media market (scarcity, consolidation, price moves)
If there are fewer publishers, there is more competition for space, and the price of that space goes up. If your media budget remains the same you can now only afford to buy less time or fewer impressions for the same money.
Less exposure to the client decreases the opportunity for brand recall, or dilutes the effect of your communications.
If the price of media space goes down, this means the barrier to entry is lower. Now you’re competing with everybody. If your media budget remains the same, you’ll be competing for attention amongst many similar brands with a similar product offering. You could use the extra money to buy even more space or impressions, but without a competitive strategy, you’ll encounter user fatigue.
If you’re already active on digital channels, investing in creative AND UX means you’re always focused on conversion. This is where to generate most of your growth. Getting more customers to the site means nothing if they can’t or don’t do anything after landing there..
I firmly believe the medium is the message when communicating on digital channels. If you want to go really nuts, you can extend the UX focus to the entire user journey. Does the ad render well across browsers, devices and publishers? Does your outreach lead to the right product and service pages? Do you capture data in a non-annoying way? Even if the creative isn’t amazing, if you can create a seamless journey to the product, you can still capture market share.
IF THE PRICE OF MEDIA GOES UP - less time in front of prospect:
You should focus on: Digital Branding.
You’ll want quick and easy visual recognition. Combine your brand identity across social channels, organic posts and advertising in order to build the recognition that is missing from a reduced rate of exposure on one channel.
Also focus on: Brand Storytelling.
Ideally you’ll have a publisher with some decent ad tech installed. In this scenario you can take multiple ad slots on a single page, rather than increased impressions for a particular placement. This allows for a storytelling opportunity across each ad window. With a CTA at the end of the story, you can filter out prospects who are unlikely to convert. (remember not all people make it to the end of a page)
You can also replicate this model across other marketing channels such as outdoor mupys. If you’re targeting drivers on a highway, they only have nano seconds to absorb the message as they drive past. Break up your story into chunks.
IF THE PRICE OF MEDIA GOES DOWN - more competition for prospect attention:
You should focus on: Value Proposition.
If there are more direct competitors in the ad space, you’ll have to focus on copy to better capture the problem identification. Include what problem you solve and, if there’s space, why you do it better than your competitors.
If you retain the same volume of media then you don’t want to do this repeatedly. You still need to increase creative iterations because in this brand awareness stage, you want to show as many audiences as possible why they need you.
Here you’ll need an overall value proposition, with multiple sub props for the segmented audiences.
1 note
·
View note
Text
DIGITAL STRATEGIES FOR DAIRY CPG BRANDS IN MENA

Dairy is a fast growth sector in the Middle East. How can packaged consumer products compete effectively? What digital strategies to use? What about the emergence of grocery delivery apps to extend points of purchase?
This presentation uses Sylphide, a low fat, low calorie single portion cheese from Groupe Bel as a case study. It looks at the brand’s current activity and makes recommendations for future proofing against competing international brands and the growing local dairy products industry.
Digital Strategies for Dairy CPG Brands in MENA from Alexandra Tohme
3 notes
·
View notes
Text
Digital Branding: Building Brand Equity for your Online Audience

(Hugh MacLeod on Gaping Void: https://www.gapingvoid.com )
The current vocabulary for thinking about attributes and characteristics of a brand is outdated. Old thinking states that brands have to be personable, and are often given individual traits as descriptors, to fit in with the target audience and customers better. However, there is place for a brand to have corporate characteristics, completely unique, that are still liked and welcomed by consumers.
Brand 3.0 will be defined by how the new companies created by millennials carve out a new genre of brand equity with a new definition of corporate values and qualities. Customers focus on trust, transparency and ease of utility as qualities applicable to both friends (individuals) and brands (corporates).
FROM SHARING ECONOMY TO CARING ECONOMY
The transition to here started in the sharing economy where individuals took on the role of traditional company based activity, leasing rooms, cars, time, etc. Here, trust factors levied on individuals took on the primary risk mitigator when deciding to transact for example reviews by peers, which highlighted trustworthiness, helpfulness; demonstrated by presence and speed of response on social media and other fora, and openness to change and customization. This led to companies being imbued with the same expectations.
In 2015 Aesop released the results of its survey of the top storytelling brands of the UK after questioning almost 3000 consumers covering more than 150 brands. Charities and tech companies dominated the rankings. Aesop Director of Narrative, Ed Woodcock believed tech companies were leading the way back then because they are “platforms for other people’s stories”, also, consumers form a deep emotional connection to them.
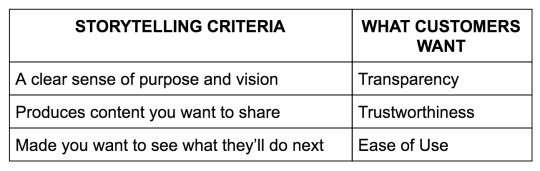
To assess storytelling, customers were asked the following:
To what extent does each brand fulfil different criteria, such as:
“A clear sense of purpose and vision”
“Produces content you want to share or talk about”
“Made you want to see what they will do next”
If we map those questions against the qualities or outcomes we mentioned in the summary we get:
THE MEDIUM IS THE MESSAGE
The survey responses gathered by Aesop adds weight to the earlier hypothesis. Deep emotional bonds (brand equity) are being formed with new styles of companies (tech platforms) that exhibit new ways of storytelling. In this way, the medium very much is the message and can define positioning strongly when competing for mindshare of the online consumer.
Because of the number of digital channels, and the consolidation of the sales funnel (awareness, sales and purchase can happen almost in one go), the opportunity for competitive digital branding has been lost amidst a confusion on where to be present, and in many cases, a ubiquitous and superfluous presence. For Brand 3.0, presence on new channels isn’t enough. It’s the judicious selection of the right channels and creating the right content to populate them.
Most ad-tech market literature addresses the problem of consumer mindshare from an angle of attention and relevance, which must of course be monetized, hence paying for better profiling of consumers and better techniques to advertise (circumvent ad blockers, rich media, or programmatic). However, the portion of the customer sales funnel this actually addresses is comparatively small in relation to how much investment has been poured into the sector so far.
The value of an online consumer across any online platform is measured in varying definitions of engagement. Whether that is a [platform specific user action eg “like”, “Retweet”, “repost”] or time spent, or shares, or bookmarking, there is a user action that results in either a user relooking at the content (repeat exposure) or sharing it to a wider audience (increased exposure). The same effects of deep bonding are not seen in ad-tech solutions which operate on a market based bidding model, capitalizing on opportunity intent, rather than customer initiated proactive desire.
The former ad-tech strategy advocates that any sale, at any price (eg retargeted discounts) to anyone (whether a customer is searching or seeing a banner ad, on any publisher) is better than no sale, the latter strategy advocates that only sales to particular people are worth any value (thereby leading with a Brand Equity model first rather than a data analytics, predictive-outcome based model).
Imagine this; if you run a small shop you can pretty much see all the data on who is walking near your shop outside, who’s inside the shop and where they are, what gender they are, what they’re wearing, etc etc. But none of this “big data” influences in store sales. In Store sales are influenced by the displays and shopper retailing strategy along with effective sales staff. Both these two base their strategy on the brand and the emotional connection with consumers.
DEFINING NEW BRAND EXPERIENCES FOR DIGITAL CHANNELS
As shopping channels move and new tech is adopted for both the marketing and the actual sale and delivery of goods, brands must focus on retaining the customer experience. If a particular medium of experience has become obsolete, it is no good to simply write off that experience, a suitable alternative should be found. Too much digital strategy has been focused on building for the algorithms and machines (Google, Facebook, Yelp, Amazon) and less on keeping the customer invested in the brand.
Another example to illustrate this point, imagine you are a luxury accessories and fashion brand. Typically in print the customer experience would be to gaze upon an A4 beautiful imagery with top class photography, models, makeup and graphic design. An image that evoked desire, envy, and aspiration. If the medium of print is no longer available, how would the brand manage to evoke the same emotions online or outdoor?
If we use a Brand based, customer experience focus whilst transitioning across technologies and media, we can mitigate against obsolescence.
Fashion brands for example, rather than move the entire customer experience online, can actually use online to drive more (but different) footfall to stores, where better experiences can take place. Or, they may provide an interface to a new combined experience (VR for example).
Financial and market based services will exploit the online medium to scale their knowledge (content creation) and find novel ways of using that knowledge to convert to more trust and transparency. Typically scaling any type of content online requires the use of intermediary “organisers” (eg search engines, restaurant aggregators etc) which makes sense as they have up til now been best for the needs of consumers. But brands need to optimize for themselves and the stories they tell, in order to manifest a tribe of consumers.
A customer specific tool that you have created to demonstrate the brand trait of ease of use, is difficult to optimize for intermediaries, especially if such tools run on proprietary systems not crawlable by other engines. But the brand still needs to make it easy to access the content that backs up the product claims, and makes it easier for customers to trust and share that content. If the main predictor of sales for these services is trust, typically generated by an in person meeting, the company has to find ways of generating the same level of trust, if no person is present.
HOW TO CAPITALIZE ON THESE OPPORTUNITIES
The crossover between an individual’s platforms to connect with others and the subsequent overtaking by an ad funded model of existence, has meant every brand is fighting to be on these mass networks / platforms, with only the variable of targeting, (supposedly becoming ever more refined) as the main driver of awareness and sales. This model works best, only when you already know the most amount of data from your customers, so you can find more “like them”. This does nothing to deepen engagement. Just because there are “more” places to create brand awareness, doesn’t mean you should take advantage of them all, particularly when you aren’t sure of the following
Does the online customer have the same buyer persona as the offline one (also is there a direct route to online purchase)?
Is it clear what type of content the online customer is looking for?
Do I have a purpose and a vision to exist online? (what if no direct route to online purchase)
Am I making the mistake of thinking about the channels first, rather than the type of content first?
Today’s consumer is used to a world where everything is built to optimize around them, they know how the algorithms work, and what they expect to see on each channel. These consumers therefore perceive a brand as more valuable, when it seems to know:
a) if and when more varied content is required and
b) what that content should be
Google has made life easier for consumers by organizing the world’s information. It has made life even easier with meta data included in search results, to the point where a keyword in the search bar can result in a phone number you can call with one click.
Brands who don’t optimize for these “facilitators” such as Google, will be notable by their absence, and indirectly also thought of as not easy to do business with.
Similarly, brands who attempt an acquisition strategy on a social network, typically accessed via mobile, but have no landing page or digital point of conversion post click, will likely be ignored in the future.
Both startups and existing small businesses who want to make more use of online channels should consider seeking out Digital Branding agencies to help them work on strategies to help them win in market.
A Digital Brand Strategy can help uncover the insights that will help you maintain position amongst your audience both on and offline, or tap into new audiences made possible by the internet. It can identify which channels to operate on, and what content to use that best matches your brand values and company resources. It will ensure your brand can communicate trust, transparency and ease of use as competitive qualities.
Finally, it will more accurately inform your design route and collateral required, which can turn into a large cost saving later on as more elements are added to the marketing mix (such as advertising, content marketing, newsletters, events and more).
0 notes
Text
Targeting the Arabic Speaking Woman in MENA

A research paper comparing online publishers in the middle east, their audience and a descriptive look at ad journeys.
Please visit: bit.ly/arabwomenmedia for the presentation [held on docs.com]
Best viewed on desktop
0 notes
Text
Why you shouldn’t let media agencies design your creative

The obsession with adtech has yielded some baffling design choices. Buying the space has somehow become more important than designing for the space. This process does not help anyone in the chain, least of all consumers, who are ultimately the people that will hopefully pay for your product.
In this post focusing on the UAE, I look at a series of paid ads on social networks and publishers, using my mobile as the primary browsing device. I look at design, copy and user journey issues which can lead to massive sales funnel leaks. Plenty has already been written about mobile being used more and more, which is why mobile optimized design is so crucial to ensure best use of marketing budget, and more importantly, prioritize the customer.
Part 1. The case of Social Media ads
Social Media remains the most abused channel for marketing in the region because marketers look at it as a cheaper channel, rather than a channel to invest in, engage in actual conversation and drive conversions. This is the digital front line after all. We have now passed the valley of despair, where the design asset doesn’t match the required spec size, and have moved on to the mountain of mediocrity as far as best practice goes.
Is this because marketers no longer want to pay for creative? Is it because they don’t know any better? Who knows. Let’s look at some examples:
TWITTER
The largest Twitter advertisers currently in terms of volume appear to be automotive ones. Here’s a selection of the top 4:
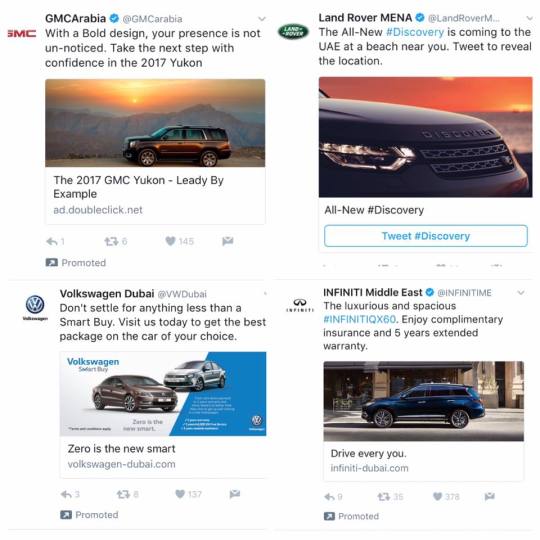
Most of them have reasonable images, but the Volkswagen one stood out for “cram as much text as possible onto a Twitter ad”. The banner text is completely unreadable on mobile. Considering that’s where most of your social engagement will be, this seems like a waste of copy.
The GMC one has a non brand URL which will not inspire confidence in prospects, but let’s look closer at some of the wonderful copy text:
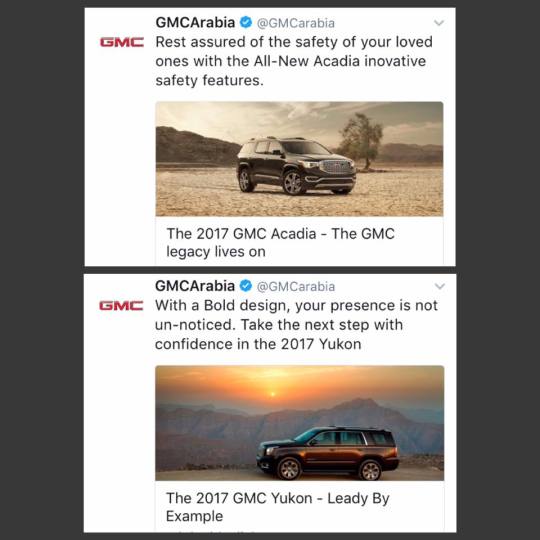
“Rest assured of” and “inovative” are basic grammar and spelling mistakes (change to ‘rest assured that’ and ‘innovative’ with a double n).
With the GMC, a double negative leads to utter confusion along with the chance to “Leady By Example”. Who’s writing this stuff? A 5 year old?
I did message them on twitter and they responded that they amended it.
Things get even better when one actually engages and is taken to a landing page of sorts, where the prospect is supposed to register for a test drive:
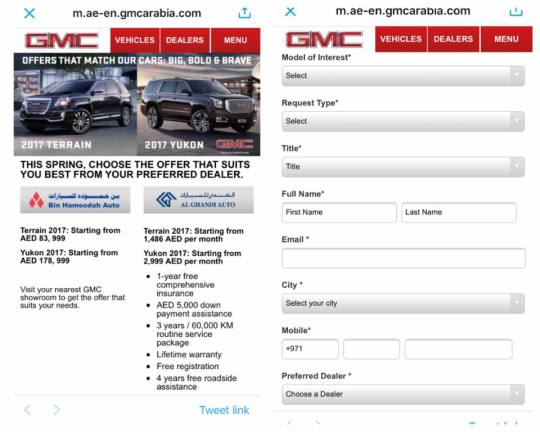
On the left, we see the first landing page, after your selection you are taken to the never ending form on the right.
For mobile users, less is more. Having one car fill up the width of the mobile browser and allowing a thumb scroll interaction would be better than presenting both options at once.
The inconsistent use of font size, emboldening and poor distributor logos all detract from what ostensibly is a premium vehicle.
Moving onto the form itself, it’s a textbook case of designing for inputs to the brand CRM / ERP system, not for the user. If you’re interrupting people on a dynamic social network, (and even if not), best practice for forms dictates 3 fields or 4 at the maximum.
Next up on Twitter ads, the Property sector:

Once again, the “leave no white space unfilled” theory is in full effect. You didn’t actually want to enjoy a full width view of the promoted apartment did you? I’ll just leave that there.
Now let’s see how Lulu tackles Twitter with a new approach, one I like to call, “SuspenseTech”

What are these magical products for these low low prices? You’ve got my attention, but for all the wrong reasons. TELL MEEEEEEE
The body copy of the tweet did include a url so I duly clicked and…..
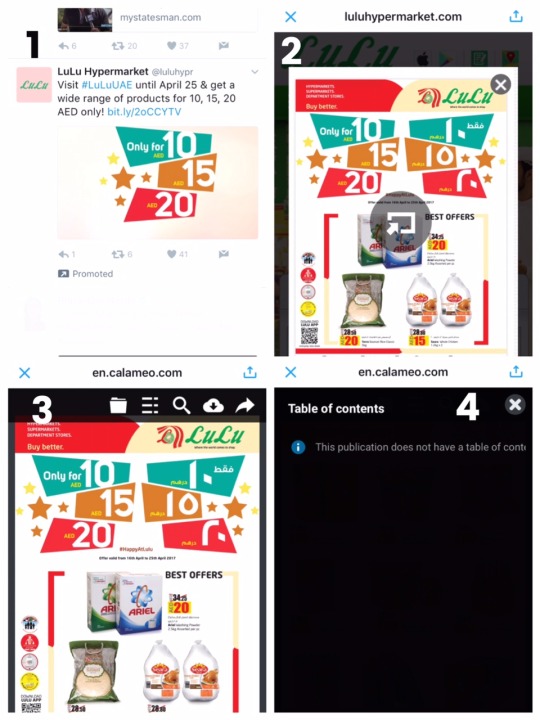
Yes, you’re seeing it correctly. It’s an online brochure. One un-clickable image. With the requirement to click something in the middle or, the X in the corner first.
But wait, something in the main menu looks like it might have more info, unfortunately, the table of contents did not have… a table of contents.
So I’ll be forced to schlep down to the store, wherever that is….
Calameo by the way is just like Issuu. For people who want to replicate the page turning experience online.
Like so
Did you spot the 1st edition of #NationTowers @myconciergeUAE magazine yet? A must for all luxury products & unique experiences #inabudhabi! pic.twitter.com/66a2Gp6M3v
I haven’t found a Twitch channel yet which gives me access to live page turning but i’m sure the good folks at Lulu can oblige.
In some cases, promoted tweets did not resolve to a landing page at all.
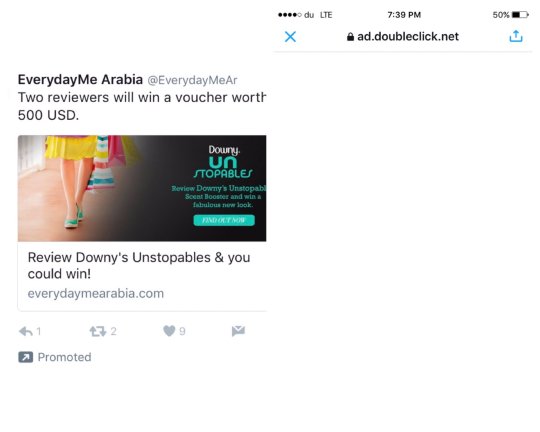
I was also about to go bananas at yet another spelling error (shouldn’t it be “Unstoppables”?) but it turns out it is actually the name of the product. Forget fake news, P&G are promoting fake spelling:
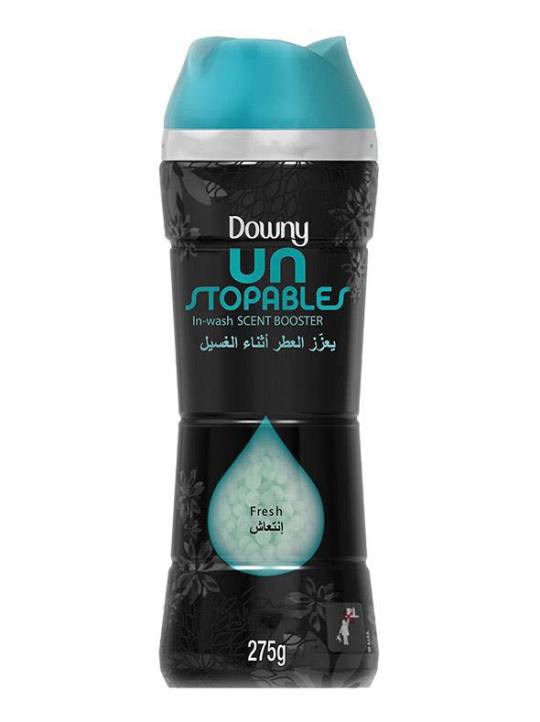
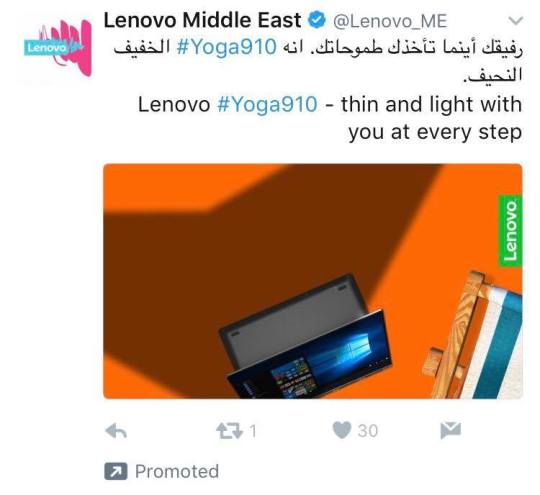
Finally, the Lenovo pad, whose english copy text makes it sound like…..a pad
INSTAGRAM
On Instagram, things aren’t much better, with the main errors being too much copy text which renders the design unreadable, or, for those ‘grams that link out to a browser, the user is led to a non mobile optimized final destination.
For the purposes of brevity, I’ll just show one example, that of twofour54:
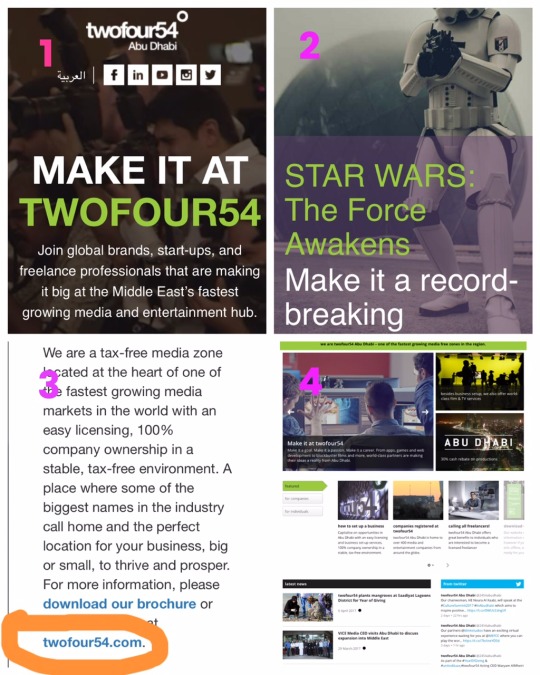
Whilst you do have to wade through rather a lot of content before you get the information that you require, at least it is optimized for mobile viewing. Obviously I’m not going to be downloading a brochure on my phone so I click the url to take me to the money page, where I will hopefully get detailed answers as per my buyer persona, and twofour can get me to hand over my details for their database.
It was all going so well, until I clicked out, and then everything just made my eyes hurt. Additionally, not taking me to an inside page meant I had to start the journey all over again and with that tiny font, I didn’t know where to start.
FACEBOOK
Hopping over to Facebook, Panasonic has clearly spent all its money on the hardware with none left over for decent graphic designers, or web designers for that matter. Take a look:
Husband comes home to find wife behind alien force field. Armed only with his briefcase, how will he reach her?

Alien force field secretly permeates dining room whilst you’re out at work all day.
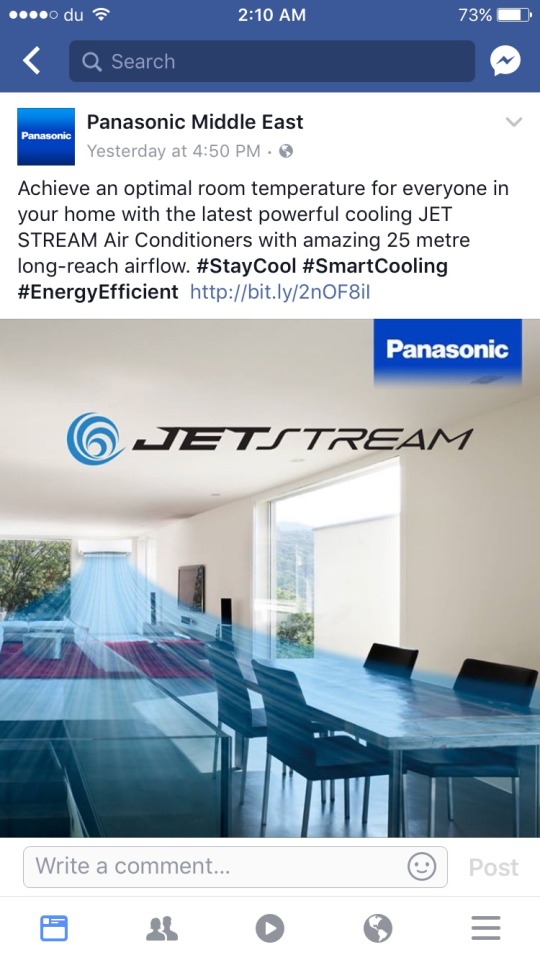
And the most terrifying of all:
Alien spores trap family in unending spiral of doom.
(also its “breathe” not “breath” - sadly aliens can’t be defeated by poor spelling)

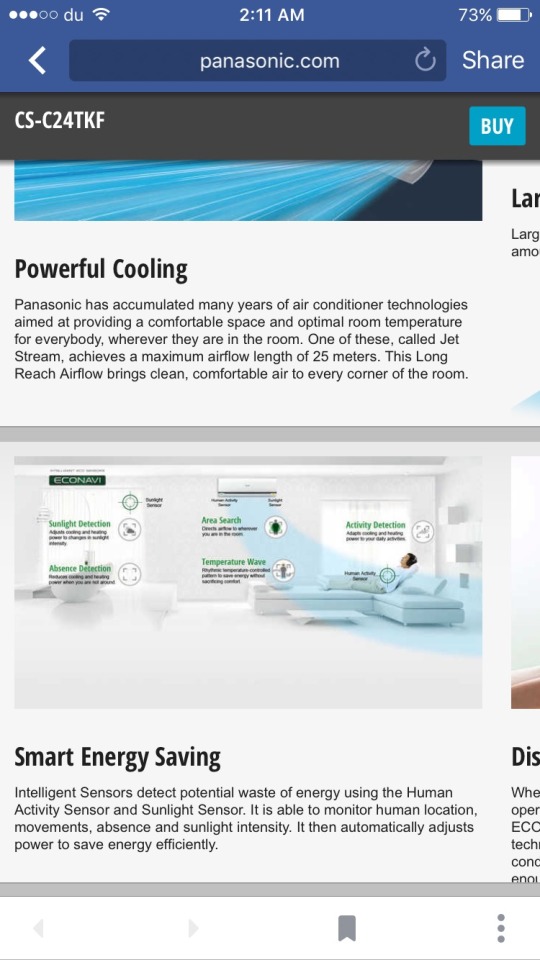
Haunted by the big blue blanket, I click on the required URL to see what else Panasonic has up their sleeve.
The CS-C24TKF could be Klingon for ‘commence countdown’. Looks like a jet engine in the background.
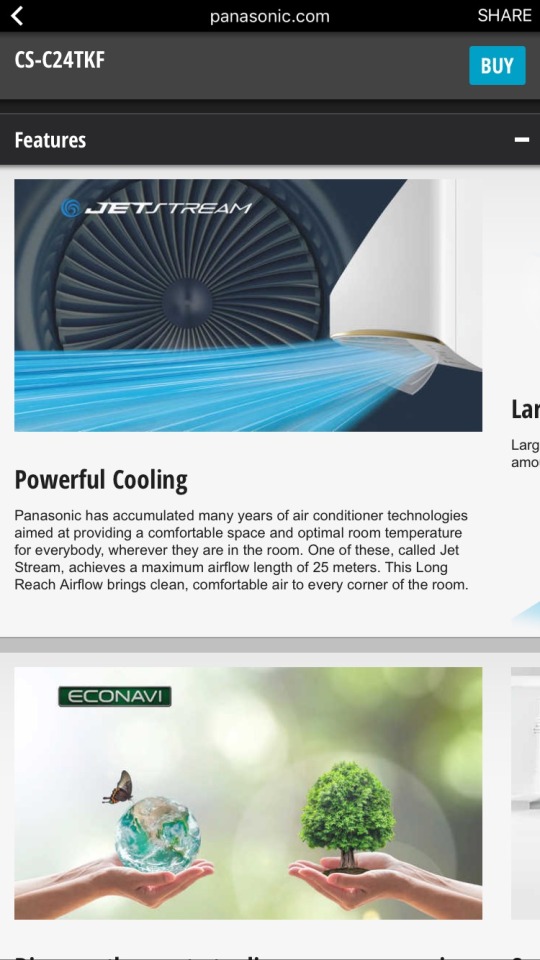
Notice that bit of text peeking out on the right? That’s how it appears in the mobile screen. You can actually scroll on the horizontal plane as well as the vertical plane. This is way too confusing and the user experience suffers as a result.
So far, I understand nothing.
Scrolling further, and the copy text is about as engaging as a plumbing manual. Also, this text-in-banner image simply doesn’t work on mobile. Everything is still way too small. If these are the most important marketable features of the product, why aren’t they more visible?
WAIT A SECOND! The blasted blue blanket of bewilderment is back and now it has green friends which are clearly preventing the woman from getting off the couch......

No review of regional creative would be complete without the old; “stick the product next to a sand dune, and the Middle Easterners will know its for them”.
Take note of the dual colors. Not sure if this means it’s blowing out 55 degree air or it counters it. Help!
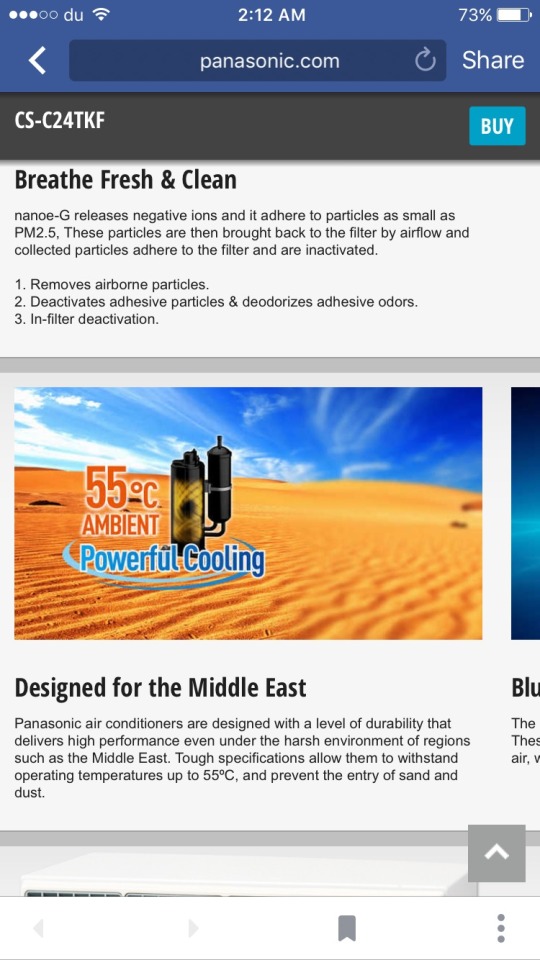
This image tells me nothing. It could be a water flask for my desert hiking trips for all I know. Why is it so hard just to get some decent images and write copy that converts. One minute alien forces are coming out my ac, next i’m stranded in the desert with this weird contraption.
Nevertheless I persist and try to navigate to buying (although I know full well this isn’t an ecommerce site).
First, if i’m online, why not default to “online showrooms”?
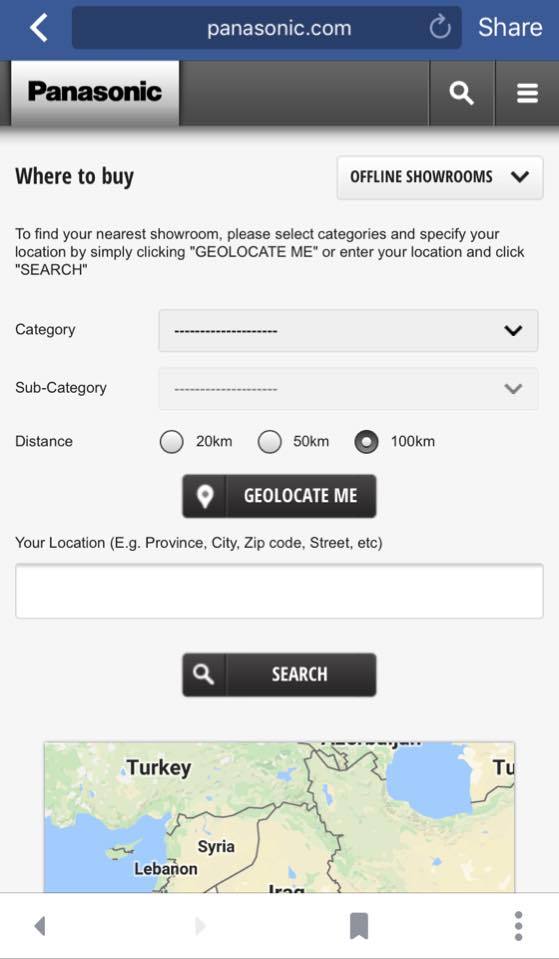
Second, just no. Its WAY too complicated to go through all the instructions. I do not want your product that badly that I need a PHD in form filling to get round your awful geolocation.
How do I know what category? What’s a sub category? What happened to our CS-C24TKF? Why didn’t you tell me what category it was in?
This is another case of repurposing content with no regard for the medium or the user. This looks like a trade marketing brochure. It certainly isn’t as engaging and easy to interact with as most B2C brands. The stock imagery gives it an outdated feel. There is no consideration to a purchase funnel here. The user is left alone to try and navigate a horizontal and vertical scrolling site, with multiple “brand names” (Jet stream, Econavi, Panasonic) and has no idea where to go or what to do.
The best Panasonic can hope for in the absence of investing in their digital channels is the dreaded “post a comment to win” type of social interaction. Which will inevitably be followed with the ubiquitous “interested please review my profile” comment, by the carefully uncurated audience, cultivated as a result of not investing in great web design and copy that converts.
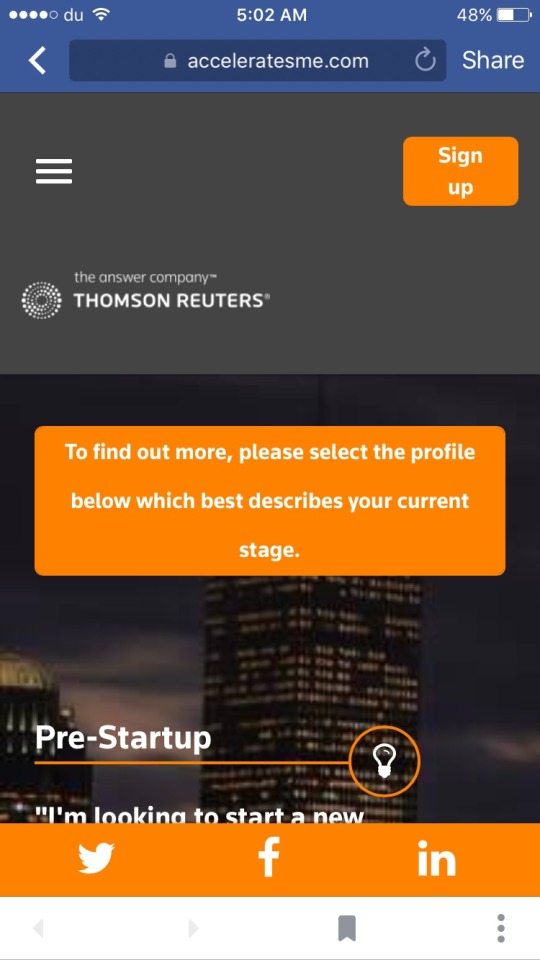
B2B audiences fare no better, with Thomson Reuters dipping its toe in the SME arena. This is a data capture exercise which is most likely being used to add to the excellent and comprehensive Zawya Company Profiles database (Reuters acquired Zawya earlier), however, the on-boarding suffers from poor mobile optimization.
First I followed the journey from the Facebook ad:

I was taken to the landing page, within the Facebook container:

Nice large CTA at the top, but the rest of the space is taken up by waffle. On mobile and particularly as a result of a paid ad, users need a bold statement, a problem that they need a solution to. This will stimulate them to continue the journey.
In addition, use of an animated header similar to Bloomberg or Backchannel would have drawn the user in

(image by Zack Grosser from Aaron Zamost post on Backchannel)
Here’s how a Bloomberg page with animation opens on mobile (video in portrait as most people will be reading this on mobile)
vimeo
bloomberg movie from alex t on Vimeo
Now obviously I’m not suggesting that Reuters throw animated lipsticks all over the landing page, but the point is that a B2B audience deserves some nice front end and it would stand out amongst competitors.
Scrolling down…
All of a sudden the header appears to have doubled in size, taking up almost half the screen. Why? And, i’m now forced to go through the rigmarole of a signup, which experience tells me will likely be painful, without any reassurance on what I will get if I do so.
I carry on browsing and...

We have entered “lasagna design” territory - piling everything on top of each other. Not a great UX.
I also saw the same ad on Instagram so I followed from there and was taken to the same site but directly in the browser. Much of the same ensued.
Below is part of the form where you register your company:
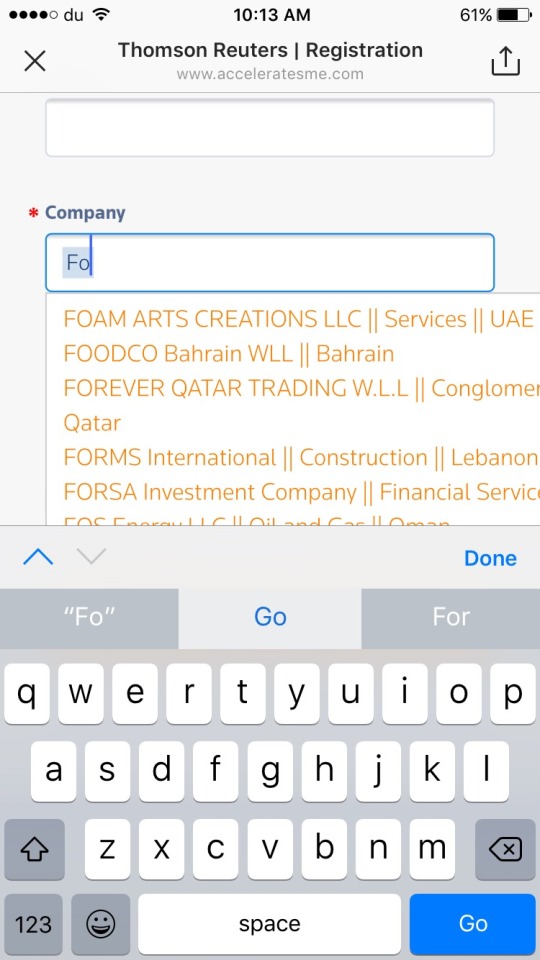
Pre-populating a form field can be super useful for users, but unless it deploys quickly and is optimized for the mobile screen (above you can see how part of the company name doesn’t fit in the window) it’s frustrating for users and often easier for them to type it in themselves.
The leaders in search tools are Algolia. Using their design and technology, users can get faster access to the information they need.
(As at the time of writing, the acceleratesme.com site is down for maintenance so it’s possible they are working on these issues)
Part 2. Publishers and Display ad journeys
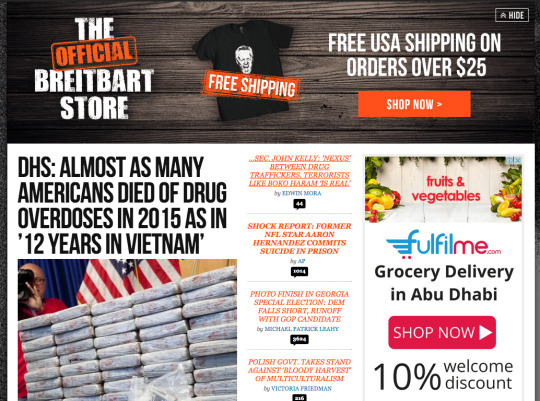
Much has been made in international marketing circles about brand ads appearing next to offensive content on social networks and youtube. Sleeping Giants has been doing a great job of actively trying to pressure brands to pull ads from hateful news sites including Breitbart.com
This is how users report the brands that advertise to the Sleeping Giants account:
@Hertz I'm a loyal Platinum customer. So disappointed to find you advertising on Breitbart, not the best brand fit. @slpng_giants pic.twitter.com/aVW9eJyOyz
Thanks to the joy of programmatic (I assume) we managed to see a few homegrown brands appear on this particular publisher:

The brands are:
Dubai Shopping Festival
Dalma Mall
Rasasi
The Galleria
Rite Bite
Friends Provident International Middle East
I tweeted at them at the time when these appeared, but none of them responded.
As of today, Fulfilme.com, an online grocery store backed by NMC is advertising (desktop site)
Regional publishers more often than not, have not optimized for mobile. This is especially worrisome as the majority of titles are franchised from the mature markets and the parent title has obviously followed best practice. Why doesn’t the franchisee follow suit?
Below, 2 titles from the Motivate Publisher, Campaign Middle East, Cyclist Middle East:
Campaign UK (left) and Campaign Middle East (right):
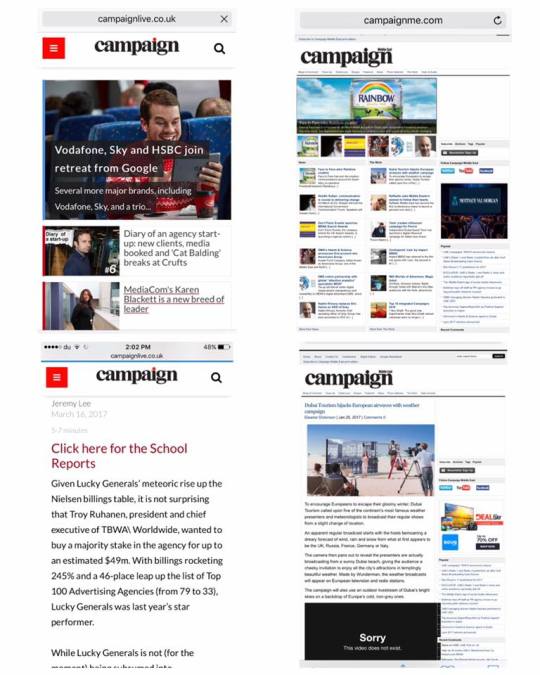
Here is the comparison of Cyclist UK (left) and Cyclist Middle East (right)

There’s a reason I picked this publisher. Campaign Middle East is a B2B magazine for the advertising and communication industry. It frequently reports on digital topics, with contributors noting on many occasions the proliferation of content consumption on mobile. It is therefore absurd that a publisher that talks to companies in this domain doesn’t have a mobile optimized site.
Leaving Thousands of Ad Revenue dollars on the table
This also leaves thousands of potential ad dollars on the table. Much of the growth in Campaign website traffic has been driven by referrals from social channels. As we already know, social is largely consumed on mobile. If Campaign Middle East were to develop a strong mobile presence, and associated ad space, hundreds more clients from the suppliers in digital technology, design and marketing would populate the space with their ads.
Using a CPC model, and potentially combined with an affiliate model, Campaign could grow its sales revenue efficiently whilst clients clearly get value for money.
Some publishers make no secret of their business model. ElleArabia.com has an excessive amount of ads placed next to a tiny amount of content:
Publisher: We need ads to support our content
Brand: Or is it the other way around….?
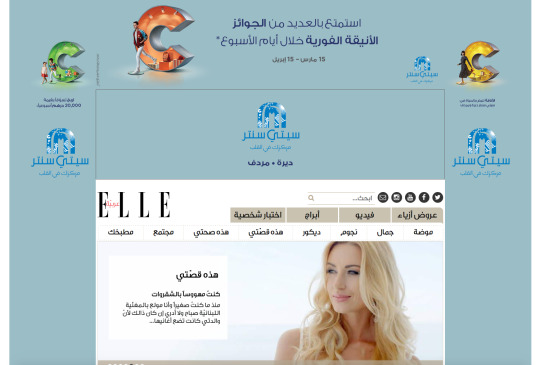
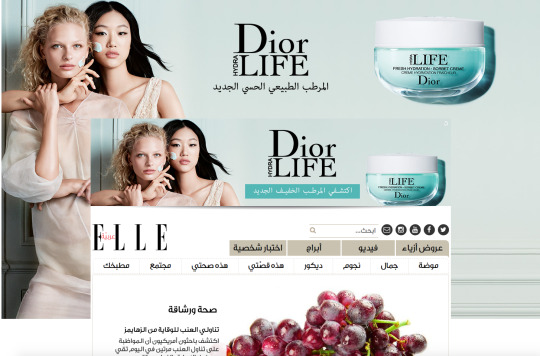
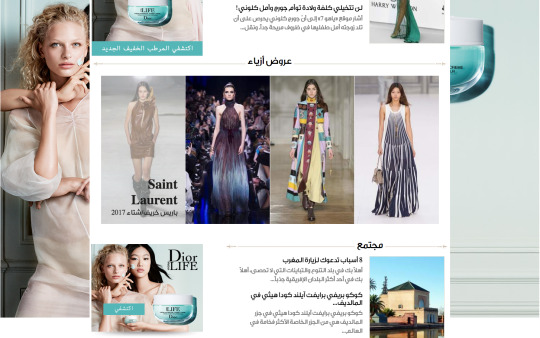
These Dior ads which appear to be on every female focused lifestyle digital property at the moment, resolve to the international site, dior.com. Ideally you’d send your local traffic to a local landing page. More on that in a later post.
More display horror from the property sector again, this time from Damac:
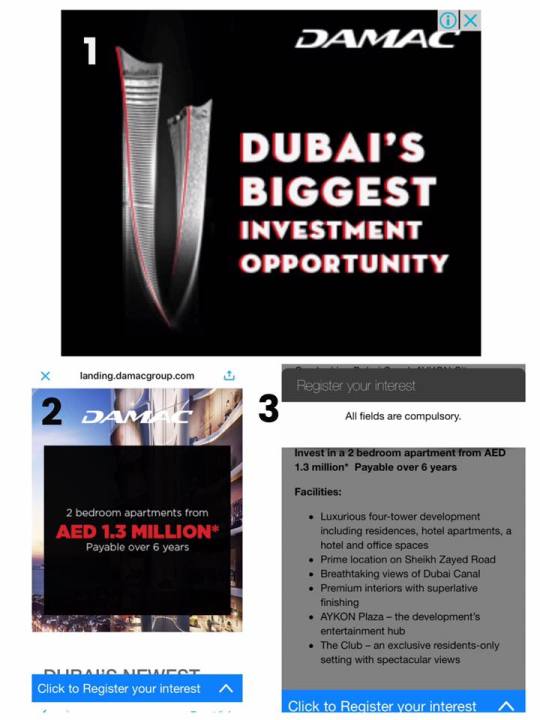
Shadows on the font for an online ad? Headache inducing.
The landing page is ok, although cutting off the sentence near the bottom of the frame makes me nervous that the rest of the mobile experience will be weak.
Unlike others in the space who utilize excessively long form fields, when I clicked to register my interest, there was no form at all.
Money is being left on the table. Again.
Part 3: Emailers
I’ll use the experience of my bank. Financial services firms are notorious for terrible design, even those who push mobile banking in their promotional campaigns appear to forget that their BTL comms needs to be mobile optimized as well.
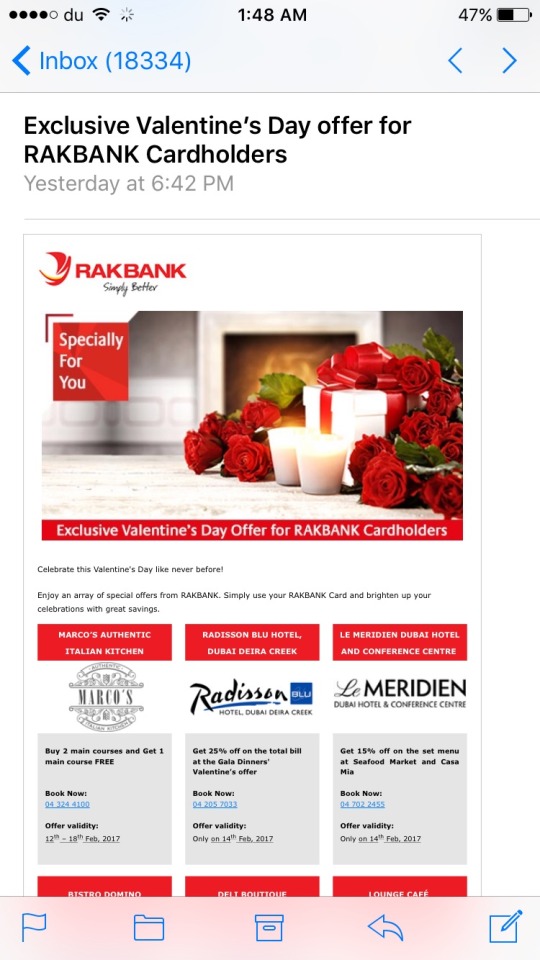
As you can see, this email is being read in my mobile device. The readable parts are the subject line thanks to Apple. You can now compare the unreadability of the rest of the text. There appear to be great offers in here but I can’t read them without zooming.
With a tri-column design, this should be collapsed in the mobile view, for a single column approach. With this tiny font, my fat thumb may misclick.
It turns out there is an entire table of offers in the email. So I scroll and zoom:
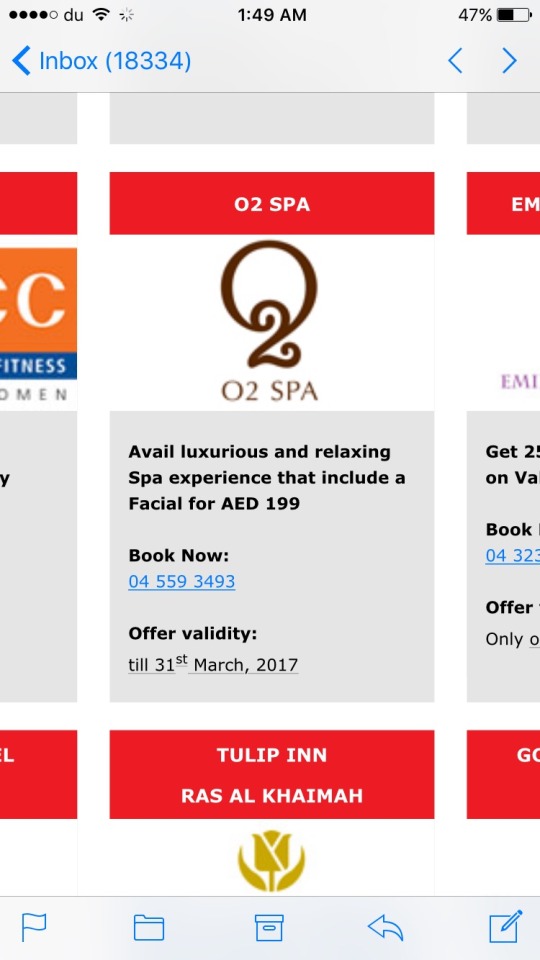
The minute I see the word “avail” i’m already put off (see analysis section for more on this).
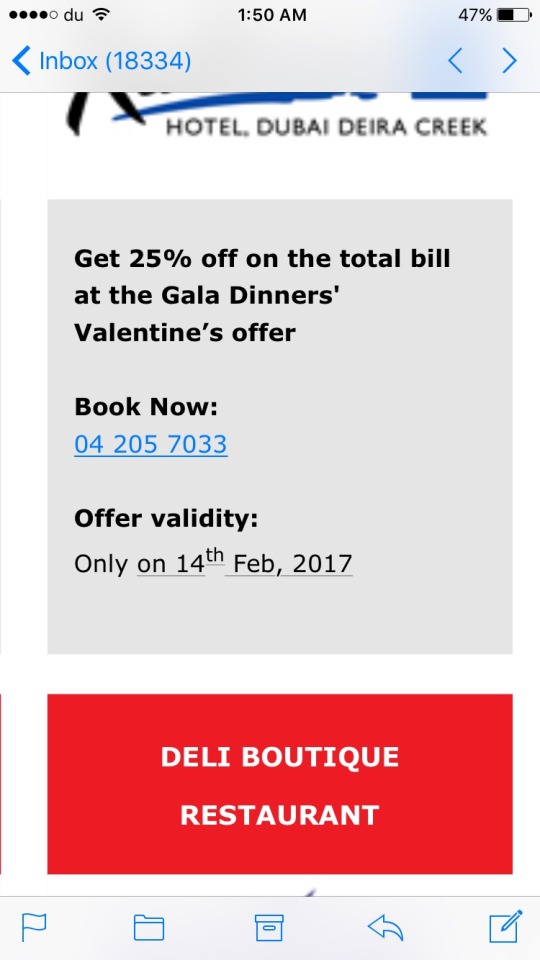
Have you noticed there is no clear CTA in each of the offers? I’m not sure what part I should click and if it will take me to the specific offer. Or how to redeem this offer. So much information packed into this mail, except what I, as the user should do.
Clicking on an offer takes me to…..
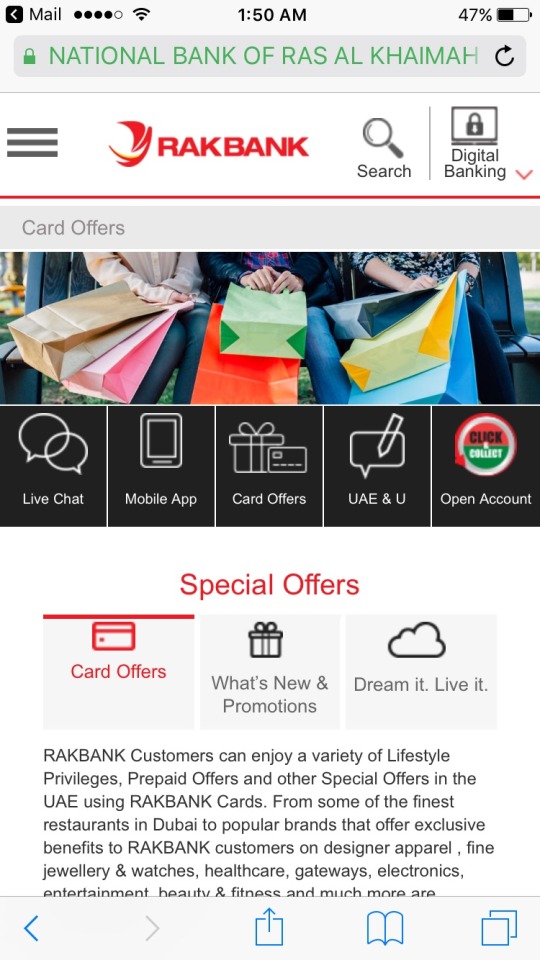
Oh great, i’m at another non mobile optimized screen and I didn’t land on the specific offer I clicked. Why? Why do i have to go through the entire journey again? How can I easily find the offer I wanted?
And what about that menu? My fat finger cannot distinctly click on one of those black options.
Co-marketing with banks and offer redemption is a great way to reach a targeted user base, but instead of optimizing for customer journeys, banks leave us to wander in the wilderness, most likely dropping out of the entire funnel. Which means poor redemption rates.
Banks make money when I use my card, so it’s really in their interest to design a journey so I will buy buy buy. I can’t do anything with this.
Here’s another emailer I received. In 2017:

I’ll conclude the design part of this post by two of the most baffling online ads I’ve seen this year:
Mashreq: we don’t like pronouns

And this: Secret Yoghurt hiding in Crisp Packet:

Analysis
All advertisers seek to engage users. Engagement comes from design and, on digital channels, by usability. Of course it can be argued that many brands seek only awareness, rather than to complete the entire journey from awareness to purchase. However, since digital is the only channel that offers the chance to do this, there is no reason why more brands cannot drive to checkout. This offers immediate ROI on your marketing spend.
Nevertheless, if the call to action on social channels is to “Learn More” or click on a link, you need to make sure that
a) the content is there
b) it is designed for mobile and
c) you don’t waste users time.
By shifting the focus back to creative agencies, you ensure that the quality of your brand does not suffer. Creative agencies have user delight at their core, media agencies are more concerned with reach and margins. Brands that do pay more attention to design can easily win here.
Let’s look at a one hypothetical example of a brand that seeks to drive awareness through paid ads on social channels:
Get the users attention in a busy timeline
Getting the users attention in a busy timeline is priority number one. This can be done by great graphics, well produced videos and perfect copytext. But don’t repeat the same creative. Users will become immune. Media agencies who do not frequency cap ads are the bane of consumers lives. Make sure you have a varied portfolio
Have a great reason to pull them out of the social environment
The next step. If you are asking users to link away from a social channel where they want to be spending most of their time, there has to be something riveting for them to do. Riveting for consumers does not usually involve filling out forms. With a varied portfolio of ads, it will be easy to measure which ones consumers are most interested in. Users will click on something to find out more information, here they are in the consideration stage. If there isn’t a huge amount more info to give them - then default to delighting them with design. Everyone will spend time with beautifully crafted design and text. If you don’t have access to great front end designers, use excellent witty copywriters.
Stick to the funnel and try to move to email
If you have managed to successfully complete this step, and you need to continue conversing with the customer to eventually shepherd them to a purchase offline (and on their own terms), then retarget them (with a different creative) on other channels, this time offering them something of value in order for them to leave you their contact details. Emails are the channel that actually result in the best ROI. But you only want to be emailing those that are far enough down the purchase funnel in order to keep conversion rates high and your database relatively clean. Again, make sure your emails are mobile optimized and use the latest design techniques.
Double check its actually mobile optimized
When designing for mobile, about 70% of brands believe that having the content fit in a mobile screen is equal to it being mobile optimized. If your senior executives cannot read all of the content or somebody has to pinch and zoom, then it’s not mobile optimized.
The ROI of Great Design
Essentially you get what you pay for with design. If you choose to spend as little as possible on creative, you will get the corresponding low quality user base. This is acutely true in emerging markets. If you’re a brand reading this you’ll most likely be suffering from a deluge of job related requests on your social channels rather than those that are high quality users, engaged in a conversation and likely to purchase. Because you spent all your money on buying the ad space and nothing on the creative to fill it.
Once again, it can reasonably be argued that the overall quality of audience in this region is low compared to other territories, why spend more when you can spend less. However, we have a wildly heterogeneous audience in the UAE (compared to other GCC markets). Higher quality users are attracted by proper copy using the right syntax and spelling, and excellent design.
By not catering to these users you are leaving money on the table. These users respond to better quality design and tend to be those that will have a higher LTV and higher retention rates.
Obviously this reduces your cost for acquiring customers, which means more money in the bank for you.
Finally, and I cannot stress this enough, investing in great design and UX at the beginning, massively reduces the amount you will spend on support afterwards. A known expenditure for design is much more preferable than an unknown expenditure on community management and engagement and call centres who you may be paying for by the hour.
Advertising online is largely a self serve method. You no longer have to go through an intermediary (ie a media agency) to get access to the space. It is cheaper to either hire or train media buying staff in house than it is to outsource to a media buying agency. If you keep media buying in house you are already saving 10 - 15% of your media buy costs (this percentage would be charged by the agency).
In addition, you get greater transparency on where your media is being spent. By spending less on media and investing more in design and creative, the results will allow a quicker ROI and the time spent to recoup that investment will be shorter. And, great design is the cornerstone of competitive advertising strategies.
When outsourcing digital design you’ll need to look for the following roles:
Graphic Design
Front End Design
UX and UI Design
Copywriters (ideally not bilingual, get one for each language you operate in)
Email Design
Mobile Design
Focus on delighting users, wowing them with creativity and usability and making it as easy as possible for them to accomplish whatever task is required.
0 notes
Text
B2B Content Marketing in the Middle East

Up to 70% of buyers complete their research and pre-buying activity online, yet B2B brands operating in the Middle East are struggling to be found. The regional B2B publishers fare no better, with 53% of them witnessing a significant decline in site traffic during H2 2015.
This report examines the digital presence of both B2B brands in the Middle East, and the publishers that support them. It looks at the difficulty of the traditional brand - distributor relationship when it comes to online search and discovery, and examines the trends in digital content consumption across various publisher titles.
Top 10 Highlights of the report:
Local buyers overwhelmingly favor whitepaper style content that contain regional case studies but it is not being supplied
Buyers cannot easily find local agents and distributors online or engage with them
1 publishing house controls almost 50% of the B2B content market
Only 40% of B2B websites surveyed had enough traffic to be audited
53% of sites witnessed a decline in traffic during H2 2015
6 out of the bottom 7 worst performing sites in terms of declining traffic belong to one publishing house
Sectors where an increase was seen in traffic were Advertising, Media, Production and Broadcasting
Only 26% of site traffic comes from the UAE
The USA and India are key sources of traffic to B2B websites
Increased activity on Social Channels positively correlates with site traffic
This is an Interactive Report - please visit bit.ly/bizcontentme for the full graphs and visualizations
1 note
·
View note
Text
Augmented Reality and the Search for ROI
The lure of augmented reality has been overshadowed by robots and drones but it has the ability to work powerfully for brands
(first published on CampaignME.com)
There’s always one tech-obsessed creative at an advertising or media agency who will find merit in suggesting an Augmented Reality (AR) application as a response to a client brief. However, justifying the return on investment has not necessarily been as forthcoming.
For events and exhibitions, the technology can work powerfully for brands that want to capitalise on buyer interest, working as complementary to – or even in lieu of – printed collateral. For the public sector – not usually known for its creativity – the use of AR to engage citizens and educate them on important sections of governance can be highly effective.
AR Campaigns in Dubai
One example of this is the My Virtual Home app by the Sheikh Zayed Housing Programme, which users could engage with at home and was executed by Dubai-based digital agency Takeleap. It provided visualisation of the architectural model of villas developed by the programme, allowing users to take a virtual tour. Another agency, B.U.T, also delivered AR solutions for the Regulation and Supervision Bureau (the independent body for the regulation of Water and Electricity in Abu Dhabi) for attendees during the 2015 World Future Energy Summit.
Education through technology is not typically tied to a quantifiable ROI, however brand studies following AR interaction compared with brand studies after a traditional campaign should reveal that the customer is not only aware of the brand, but more importantly, has a better understanding of how the brand is relevant to them.
Dany El Eid, founder of Pixelbug, a Dubai-based AR technology firm, says: “Depth of engagement not breadth is important for brands competing for mind share.”
Pixelbug’s work with Nestlé during 2014 led to a 9 per cent increase in sales for its Nesquik brand targeting six to 12-year-olds. He credits this to the fact the AR component was triggered whilst the product was in use in the home environment, bringing the product to life and making a powerful product/engagement connection.
This concept is the subject of many research papers which state that virtual experiences make the customer-brand relation more effective through the psychological states of presence and belonging to the proximity of the ad, involvement with its brand/product advertised, and entertainment offered. Studies also suggest that there is a constant connection within any medium; between the human mind, the technology and the environment that serves to immerse users resulting in augmented learning, altered behaviour, and a perceived sense of control. “As a result, consumers, particularly children, may feel a heightened degree of intrinsic motivation, intense concentration and enjoyment while engaging in these technology interactions,” wrote Barrie Gunter in Kids and Branding in a Digital World.
It was these findings that supported McDonald’s use of AR on its packaging for fries during the 2014 Fifa World Cup. Users were able to play a virtual game of football using just their phone and the packaging.
AR technology doesn’t just apply to top tier advertisers either. Brand marketers who don’t have the budgets to execute TV campaigns, or are looking for more accurate engagement stats than can be found from traditional digital display campaigns, can benefit from using AR to enhance the value of their product and establish a competitive advantage. Blippar, a well known AR provider, claims dwell times in excess of 75 seconds, which is 2.5 times the average of TV or radio ads. As brand marketers know, the longer the consumer is engaged, the better the chance of being recalled.
See Pixelbug in action on Maestro Pizza boxes in Saudi!
El Eid expounds on this, saying the element of control is key. Consumers who are actively engaged with a product in 3D advertising rather than simply being a passive consumer of 2D advertising show high intent for repeat purchases and consider themselves more informed. “When it comes to children, we see this control factor more than ever,” he says. “Everything is a potential toy for them or something to explore. That’s part of their learning experience, trying to control the environment around them.”
El Eid should know. Last year Pixelbug won the MIT Arab Startup competition for its Colorbug AR product, aimed specifically at children. The most interesting feature of the product is not the technology however. It is the change in business model. “Brands know quite well the effect of interactivity on children, but up until now the lead times and cost of developing branded apps and marketing them has been too expensive for them to consider doing it at scale. Colorbug is an open application platform that the child uses, and can interact with any enabled branded content. Even the placemat in a restaurant.”
youtube
Dany El Eid will be discussing unleashing your inner child with creative tech at the Dubai Lynx on March 6
0 notes
Text
How likely are you to win at 2017?

New analytics tools, including this anthropomorphic gorilla, can yield results with a greater level of accuracy than ever before. Take this simple test to find out what the rest of 2017 has in store for you.
Our quiz has distilled the key risk factors down to 8 personality traits so you can plan with an unprecedented level of foresight.
Scientifically proven by scientists using actual science. (and GIFs)
Wait for the quiz to load below and find out if you’ll make it through the rest of the year
0 notes
Text
Reverse engineering the Insydo Campaign

On February 1st, Insydo, an online listings and review guide for Dubai posted the story behind their first media campaign on Linkedin. As self described online startup, the heavy use of expensive outdoor billboards may have appeared esoteric to some. However, Insydo goes against current popular thinking by suggesting to “Redirect your budget into media placement instead of creation”.
The key analytics that would have been of most use would be the cost per acquisition (budgets are not stated), and given the use of outdoor it is difficult to attribute which channel is most efficient. Further, understanding the conversion rates from their landing page to the final site would be a helpful metric to prove the efficacy of digital funnels. They do mention that the bounce rate dropped by one third from 60% to 39%.
I attempted to reverse engineer the campaign with the data that was available to see if any further insights could be gained:
Outdoor, Display and Social led to the SaveStevesJob landing page from where users would then go to the Insydo page.
Knowns (from the Linkedin post):
2 million Facebook impressions (through paid and organic)
CTR of 0.13% for their “Display” campaign
Facebook competition entries; 650 out of 500,000 (a conversion rate of 0.13%)
Searches executed on Insydo, 268,000
Assumptions:
Facebook and Display bought as CPM not CPC
Estimated CPM for Facebook between $0.78 and $1.39
Estimated CPM for Display between $1 and $1.4
Estimated conversion rates from SaveStevesJob landing page to Insydo at 35%, 50% and 65%
I ran 2 models:
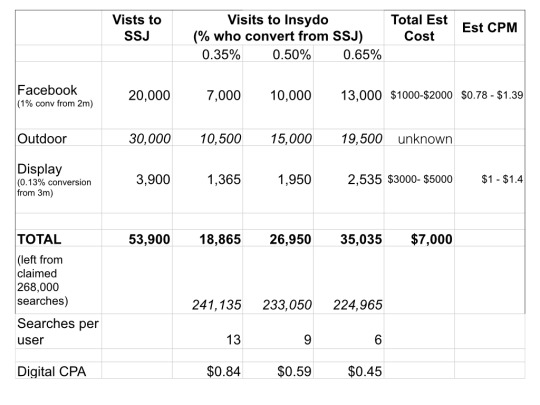
Assuming Facebook CTR of 1% and volume of Display impressions at 3 million
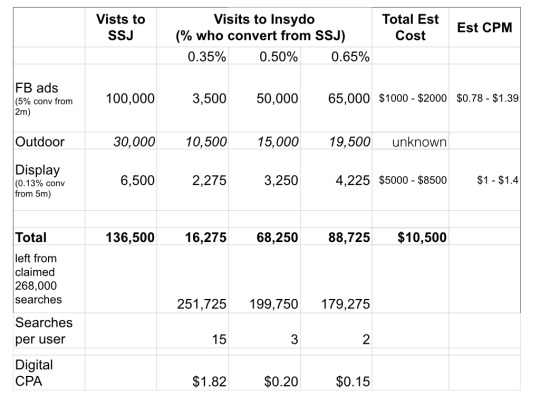
Assuming Facebook CTR of 5% and volume of Display impressions at 5 million
Model 1:
Model 2:
The effect of Outdoor
There is no way for us to tell the the actual number of visits from outdoor on visits to SaveStevesJob. I have simply used an estimate of 30,000 visits to the landing page for the purposes of the exercise.
Outdoor could have had an uplifting effect on people’s propensity to click on digital display ads. Local market conditions usually show an increased confidence amongst customers when billboards are used. One way to measure would be to note any mobile search activity for those keywords during peak visibility times.
Direct and other routes
Paid channels of course will not be responsible for all visits to the site. Because of the combination outdoor and online and the catchy URL, many people may have typed in SaveStevesJob directly or shared with friends on social channels.
Searches per user
We can assume that the 268,000 searches on Inysdo are not all unique users. Indeed the purpose of a good listings and review engine is to encourage repeated use, thus proving the stickiness of the platform. The calculations given in the tables are made by dividing the “left from 268,000” by the Totals given.
It’s unlikely that the average person would do as many as 15 searches, ideally they would do more than 2. A more reasonable estimate would be perhaps 3 - 5.
Analysis
Running outdoor and digital concurrently makes it difficult to ascertain exactly which channels are the most effective. One could argue that using digital first to drive through the SaveStevesJob page then utilising outdoor to promote the final product, Insydo, may have been more effective. Is there a possibility that users will remember Steve rather than the final product and continue to go through this funnel? Perhaps Insydo will opt to keep the landing page and change the content regularly so as to prevent user boredom if this is to be the case.
Understanding the conversion rates from the landing page to Insydo is key. This type of information is particularly useful when combined with the value of the final user. It is also useful for considering best practices when it comes to B2B marketing, where the marketing focus skews more towards revenue than awareness. Fewer qualified leads are better than more unqualified leads. The decrease in bounce rates are one indicator that this worked.
The Cost Per Acquisition (CPA) can only be understood if it is known what the value of a customer search is to the company. Assuming a model where businesses will pay an affiliate commission to Insydo if a user makes a call or visits their website, the CPA should be lower than the amount Insydo will receive. At this stage in time CPA’s will be skewed because of the high cost of media campaigns. Understanding the LTV of a customer and the frequency of search activities before a final action is taken is also key.
Currently all the information required for a user to take action is immediately visible, meaning there is no requirement to “click to reveal phone number” or “register to get full details”. In order to mitigate drop offs in actions and to keep Insydo from being a static engine where users consume information only, there are a couple of options:
Either Insydo becomes a platform, tying in with GuavaPass (for fitness class bookings), Talabat (for food ordering and delivery) and other 3rd party transactional sites, allowing users to execute everything in one place;
Or, when they launch their mobile app in March, users will receive push notifications when they are in the vicinity of highly rated businesses, complete with offers and mobile coupons.
Facilitating transactions becomes more important to counter the effects of customer loyalty. For listings sites, once a user has found a business she is happy with she may not be as keen to search again. For businesses however, the value of that loyalty is a bonus. Key metrics here would be:
How many businesses does a user try before she sticks to one?
How many activities does a typical user have capacity for, and what categories do they fall in?
What is the maximum number of businesses a user will interact with? (does she have a top 3 between which she rotates? Is it 5?)
Does location have a positive or negative correlation with the previous point?
Giving users more opportunity to transact allows a greater value to be placed on that user once they come to Insydo, and therefore allows an increase in CPA, which will alleviate constraints on marketing budgets.
A final consideration should be given to the data on user behaviour being used as a potential revenue stream. Both Insydo platform and external data can be used to provide a richer profile of consumer behaviour, allowing businesses to optimize selling accordingly.
Insydo could ultimately provide the following information:
Single women living around Tecom / Greens / Marina tend to search for upscale food options whilst at work on the desktop. They are fairly loyal when it comes to beauty concerns, searching for different treatments on average twice a month as treats, but will regularly search for health and wellness activities even several kilometres away from their home. There is a positive correlation between choice of fitness activity and mid week nightlife choices. Those who search for yoga and pilates classes have a high overlap with searches for ladies nights.
Lots of luck to the Insydo team and here’s hoping to lots more data!
0 notes
Text
Wealth building whilst Renting in Dubai? Forget it

Unfavourable rental terms combined with information opacity obliterate the opportunity to invest in the future
One might think that young single professionals in the UAE are perhaps not as sensitive to the rising costs of living compared to families; particularly because they don’t have education or childcare to think about. However, as The National reported in November 2015, 88% of “affluent people” described as those who earn more than $8000 per month are in debt (source, Citibank and YouGov survey). More than 71% of those polled own more than 1 credit card with almost 1/3rd using those cards daily.
Part of the reason for widespread indebtedness across the board is the rising cost of living including rent and food, and overall inflation, measured at 4.4% during 2015.
In this post I demonstrate how information opacity combined with rental terms unfavorable to the tenant, completely obliterates young people’s chance to start building wealth and investing in their future.
Both individuals and financial advisors can benefit from the calculations in this post in order to plan better.
When deciding to rent a property in Dubai you will need to take into account:
The advertised rental rate
The agency fee (5% of advertised rate)
The landlord fee or deposit (we use 5% of advertised rate)
DEWA (utilities) deposit of 2000 aed
Telecom deposit of 1000 aed
Ejari fee of 200 aed
All of these amounts together will give you what you will actually be paying over the year.
For the report I have shown effects of all variables on flat prices advertised at 65,000 AED yearly rent up to 90,000 AED yearly rent in increments of 5000.
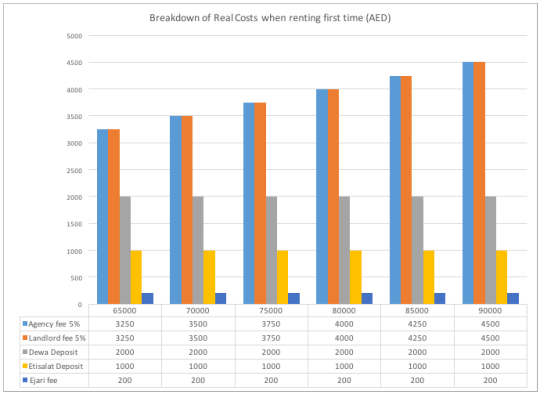
The next graph shows how much you will actually be paying during the course of the first year when all the additional fees are taken into consideration (Blue column)
Since tenants are entitled to their utility deposits back at the end of the year when they vacate, and I assume 65% of the landlord deposit will be returned, I have shown in Orange what the net amount you would pay if staying just for one year would be:
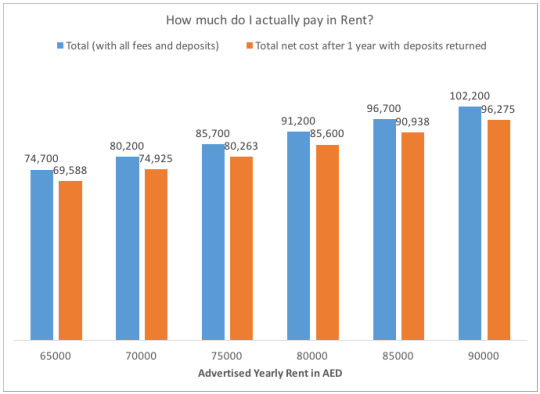
A better way to express this is by looking at the percentage increase on the advertised cost of the apartment:
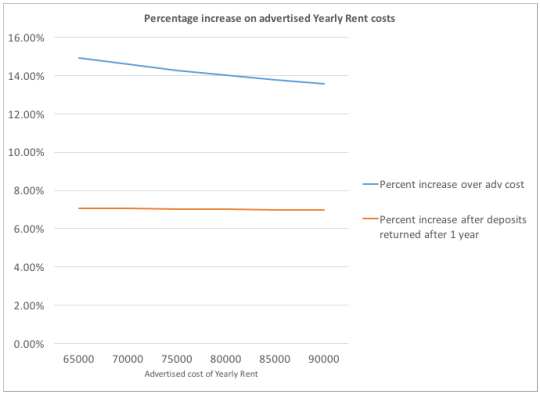
When looking at the gross cost over year 1, the percentage decreases as the base cost of the apartment increases. This is because as far as utilities deposits go, it doesn’t cost anymore for a deposit at a cheaper flat vs a more expensive one. On average there is a 14% increase over the advertised cost of an apartment.
The net percentage increase remains fairly consistent at around 7% more than the advertised cost of the rent.
Because rent cannot be paid monthly, rather it is split into a few cheques, the deposits and fees make the first cheque instalment particularly daunting when renting a new place.
I have assumed a rather generous 4 cheque and 3 cheque instalment plan and calculated just the first cheque amount as follows:
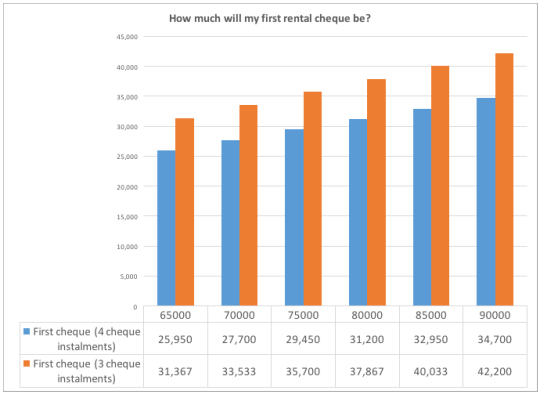
As you can see, an apartment advertised at 75,000 AED would require you to have almost 30,000 dirhams upfront if paying in 4 cheque instalments. That’s because our “How much will I actually pay in Rent” graph shows us that the real cost of a 75k apartment is actually 85,700 AED, due to the fees and deposits totalling 10,700 AED.
Assume now that you decide to extend your rental after the first year. We take an average 10% increase in rental prices across the board. Clearly you will not be paying the agency or landlord fees again, neither will you be paying your utilities deposits.
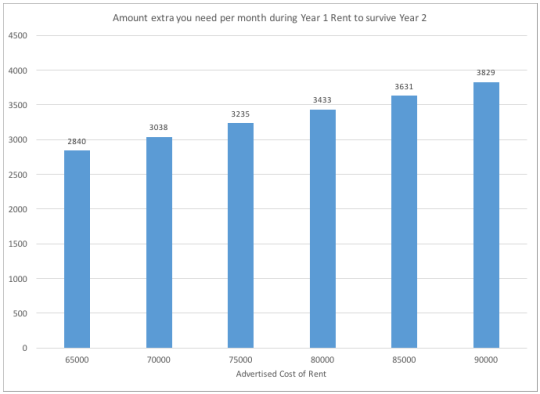
However, because we are still out of pocket with those, and we have to account for the 10% increase in rent we can calculate an accumulated defecit at the end of Year 1, moving into Year 2:
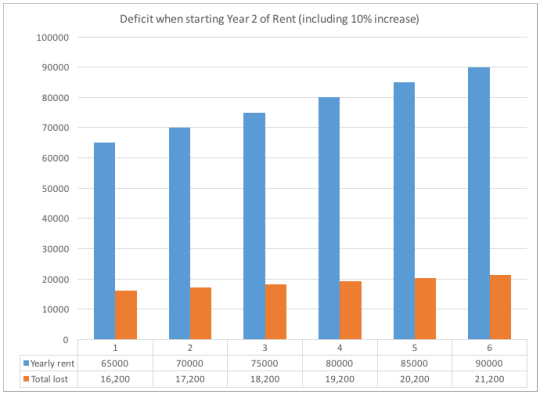
Breaking this deficit down across 12 months, we can now see what we either need to save, or generate extra in order to not only cover our loss from Year 1 rent (the deposits, fees etc) but enable us to withstand the increase in rent during Year 2:
CASE STUDY:
Imagine Bob earns 18,000 aed per month. He takes an apartment for 70,000 aed imagining that it will cost him 70,000/12 (5,833 aed) plus his bills.
He does his accounting as follows:
Rent: 6000
DEWA: 450
Etisalat: 320
Transport: 2000
Food: 3000
Mobile: 500
Cleaning: 400
Entertainment: 1000
Miscellaneous: 1000
Total: 14,670 AED (we’ll round it up to 15,000)
So he envisages saving 3000 dirhams per month. He can put some of this away or take a few trips to Sri Lanka or Turkey over the year. He can buy his girlfriend a nice present, he can go out to dinner a few times a month. All that good stuff.
But Bob can’t pay his rent monthly. He has to pay in 4 cheques. The total yearly amount he would pay including all the fees and deposits is actually 80,200 AED.
So realistically he should be budgeting for 80,200/12 = 6,683.
Let’s call it an even 7000 AED.
Already that adds 1000 extra dirhams to his rent line item, and the “savings” have decreased from 3000 to 2,000.
Cashflow
Cashflow is where everything becomes a bit trickier. Bob’s rent is paid in 4 cheques which means he has to have large sums available every 3 months, rather than a monthly payment of 6 or 7000 AED.
He’ll need to have at least 27,700 AED to make the first cheque (as we demonstrated in the graphs at the beginning) and have some working capital to cover his normal expenses before he gets paid his salary at the end of the month.
Therefore we estimate that Bob needs at least 40,000 AED in this example to start with.
If Bob has enough upfront at the beginning of the yearly rent cycle, he will avoid getting into further debt.
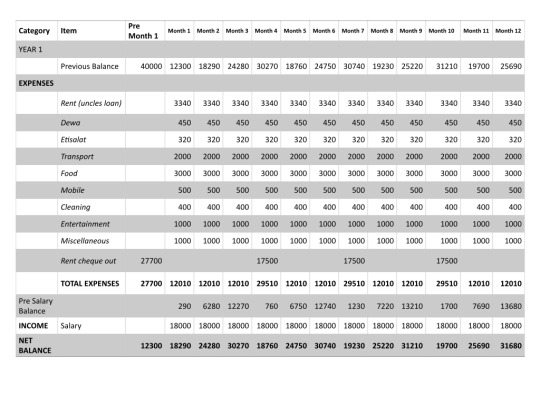
Note that in the table, I have assumed Bob is able to take a loan from his Uncle for the 40,000 AED required. This is to be paid back monthly at no interest.
Now 12 months passes and Bob’s flat is up for renewal, this time with a 10% increase. His new yearly rental amount is 77,000 aed.
This time he doesn’t have to pay any agency fees or landlord fees or utility deposits, so his monthly rent is 6,416 AED
Year 2
Rent: 6416
DEWA: 450
Etisalat: 320
Transport: 2000
Food: 3000
Mobile: 500
Cleaning: 400
Entertainment: 1000
Miscellaneous: 1000
Total: 14,636 (we’ll round it up to 15,000 again)
Wonderful, it still seems manageable. But let’s not forget Bob has to pay in 4 cheques. The first cheque is due directly after the first 12 months are up.
His first cheque this time will be 77,000 / 4 = 19,250 AED
As we previously demonstrated, so long as Bob has enough for the first cheque AND one month of living expenses from his savings at the end of Year 1 prior to receiving his monthly salary, he will be fine. According to our table, he should have 31,680 AED so that works out.
At a glance view of how much you will need at the beginning of each billing cycle relevant to yearly rent:
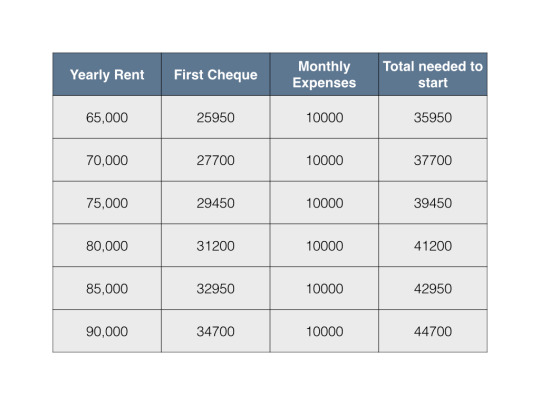

The main question becomes how to generate the capital required (Total needed to start column). Most people end up taking a loan for the full yearly rental amount from the bank, adding interest to the rest of the fees and deposits which accumulate in the first year. Ultimately the consumer will always be at a loss.
Indeed the banks may also be at a loss considering the amount of bad loans currently on local banks’ books. Gulf News reported that borrowing was growing at “an alarming rate” in an article last year, stating “As of June 2015, UAE residents borrowed a total of Dh1.178 trillion from ten major banks in the country, up from Dh918 billion in the same period last year.”
By November 2015, The National reported that outstanding loans were Dh 1.4 trillion. “Bad debts” accounted for Dh 45 billion ($12.2 billion) of that amount.
Whilst there (currently) is no formal tax structure in the UAE, individuals and businesses often face heavy upfront costs meaning that borrowing is the only option to facilitate living and working. Bloomberg recently reported that banks prefer lending to SME customers as they can charge higher interest rates, yet in November it was reported that many SME owners were fleeing the country leaving behind debts of more than $1.5 billion.
Such forms of leveraging at the beginning of any venture ultimately lead to an ongoing indebtedness. This may be good for the bank’s bottom line as they benefit from recurring interest fees, but in practice this impacts the overall effectiveness of employees and efficiency of the market. If wages do not grow as fast as inflation or rent prices, consumers will be spending more time paying off debts and less time producing work. As they move farther out to be able to afford accommodation they will spend more time commuting, often ironically having to take on more debt to finance a car as public transport links are few and far between outside the main hubs. Employees will forever be shifting employment hoping to increase their topline in order to mitigate rising costs. This causes businesses to lose knowledge and impacts growth.
Were the issue of rent to be solved, whereby individuals could pay monthly, have a more accurate picture of their finances and be able to forecast appropriately, they may be in a position to put their savings into investment vehicles that can generate wealth. Particularly, they may wish to keep some of that money inside the country, investing in other local businesses in the fields of F & B, eCommerce and fashion and beauty.
Conclusion
Assessing the full scope of upfront costs is important when looking at the advertised property rental rates. Even taking those new figures into account, the importance of cashflow cannot be underestimated. A general guideline before taking on a property lease for a single professional might be to have between 40,000 and 50,000 AED available. Avoid getting into the cycle of debt by opting for shared accommodation before living on your own, where monthly payments allow better planning and opportunities for saving.
0 notes
Text
Data not Diet - how i worked out

I have spent a little over 12 months going to the gym to see if i could hack my body. The purpose of this post is to share some of my learnings, but in no way should this be taken as any sort of advice or guide [disclaimer complete!]
Background
I naturally have a very lean body, but had managed to balloon to 72kg (just over 11 stone) by the end of 2014 as a result of an issue with my pituitary gland; which went undiagnosed for a very long time, and the usual “dubai stone” phenomenon. At this point, the expense of buying a new wardrobe was unsustainable. I also had some sort of knee problem which was not related to any trauma, sport injury or otherwise. This meant it kept getting “stuck” and was painful for no reason. My goals were to lose the fat and build a lot of muscle...
Actions taken
I didn’t join a boot camp or cross fit club or try and do my own gym routines. I knew that my mental discipline had dropped, so on the advice of a friend I signed up with his personal trainer (contacts at end of article). The first few weeks were spent realigning my posture, very deep pressing of my muscles and trying to balance in preparation for weight training.
My workouts were almost exclusively weight lifting. I did very little cardio at the beginning, and as I got stronger or wanted to tweak some effects, I would add 15 - 20 minutes at the end of an hour long weights session to increase fat burning.
Data capture
I used a machine at the gym to regularly weigh myself and give a reading of muscle to fat in order to plot change over time. There is no such thing as an absolute accurate reading, but recording these measurements especially over the course of a year, generated a good starting point to be able to plan future growth.
Here are some graphs to show the change:
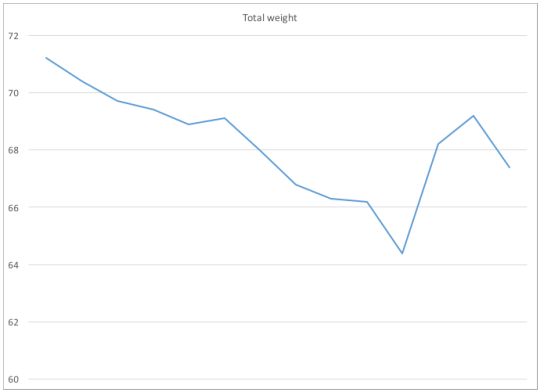
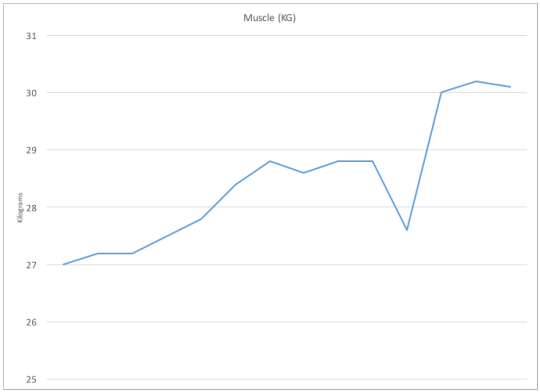
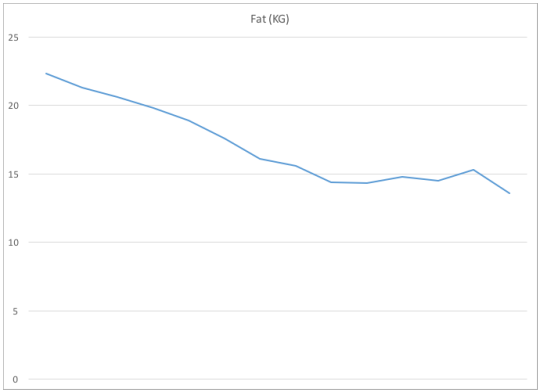
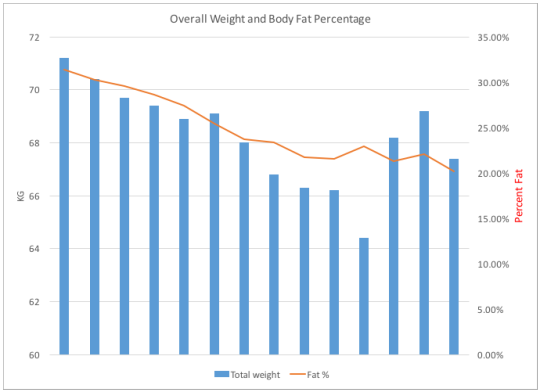
Summary stats:
Total weight kg
71.2 --> 67.4
Muscle kg
27 --> 30.1
Fat kg
22.3 --> 13.6
Fat %
31.4 --> 20.1
Learnings
Identify your natural body shape and work around that
It might surprise some people to know that the ideal body shape in my view is a more voluptuous curvaceous figure. But i’m simply not built like that. At my fattest, i didn’t look curvy, I just looked wrong because the fat was not distributed in the right way. It was as if you could see I was a thin person who had got fat.
In my opinion, knowing your body type is key to being successful in whatever goals you wish to achieve. There is simply no point in trying to look like something that your body was not built to be. If you have a particularly short mid section then no matter how much you work out, it’s not going to get longer. If you have very long thin legs, it will take you a lot longer to bulk them up, if that’s your goal. And some people just don’t look good when they are really thin. Based on your goals you can decide what activity is right for you.
You can also decide to target specific areas of your body. The current trend for women is to build a large behind without necessarily the corresponding development in arms or chest. This is usually done by light resistance training all over the body, intense resistance training for the glutes and legs and plenty of HIIT or cardio to keep fat down.
After my year of working out i have built considerable upper body and core strength. My lower half is not quite as strong because I took a long time to start squatting and deadlifting due to my knee injury which is now fixed. What I also noticed was that the general flexibility of my lower half is terrible, which also affects the amount of weight I can handle, particularly on squats. I need to spend a lot more time stretching, and possibly doing yoga.
As at time of writing I am currently deciding whether I continue to build mass, or I cut down the weights and switch to boxing to give me an all round leaner look.
Don’t stress about diet
Everybody’s body is different. As the graphs show I can easily lose fat, but i struggle to gain muscle at the same rate. The result of this was not quite reaching my muscle or strength goals at the end of 2015. This is because I need to eat a huge amount of calories per day consistently. In particular, the timing of those calories is key. More on my meal prep at the end.
In my experience, the body is pretty good at self regulating in different environments. Rather than focus on overhauling your food at the same time as starting a new training plan, focus on building the training routine first and then make dietary changes.
The reason for this is:
a) you will have a better chance of success by not employing too many changes at once and
b) it’s easier to measure the effect of variables if you alter them one by one rather than all at once.
Having said that, since most people’s goals are to lose weight (fat), simple math dictates that expending more calories than you ingest will achieve this goal.
Lifting weights is a very efficient way of losing fat because your body changes to a “constant burn” state, compared to cardio. However, this might not be suitable for a lot of people. For women, there is a tendency to think that a few lifting sessions and they’ll turn into a beefcake but this simply isn’t true. You would have to be training twice a day and eating upwards of 2500 calories with an extremely high protein and carb intake to really worry about that.
Another factor to consider is any associated health or medical issues. When you train, it has an impact on your diet and hormones. I need to eat 150 grams of protein or more a day and at least 200 grams of carbs, however someone else who suffers from high uric acid, or diabetes may not be able to follow the same diet. Understanding what types of fuel you need for what type of workout will really help in reaching your goals.
If you can’t eat a lot of protein, you may want to focus on more cardio intensive activities, which will in turn require a lot of carbs to give you the energy to complete your 30 minute - 1 hour workouts.
Those who have Type 2 diabetes would probably do better on diets rich in foods with a low glycaemic index, which may mean there is less energy available for intensive cardio workouts. These people may need to focus on resistance training which will encourage the body to start burning fat for fuel.
Again, the important factor here is to try and see how your body feels and collect data.
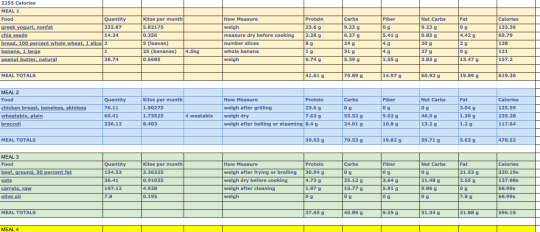
Preparation and budgeting
Losing weight doesn’t have to be expensive, but building muscle is, due to the amount and quality of food you have to eat. Whilst my motivation to go to the gym was high and i definitely saw results, I knew I could do better during 2016 by planning and preparing my eating.
First I had to work out just how much food i should be eating. There are many ways to calculate this but I used an online tool that helped calculate my macros and had a link to a meal planner. If you have money falling out of your ears, then finding a sports nutritionist would be the ideal route, but to start with and to keep in line with data collection I used whatever free tools were available, as well as doing a lot of reading around the topic.
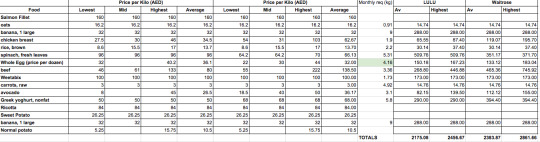
The second part of this was to then workout how much this would all cost. I went to two supermarkets at the lower and upper end of the spectrum and made notes of prices for different quality of goods. This resulted in a clearer picture of what I could expect to spend on average per month.
I had attempted this before and my mistake was to buy the entire month’s requirements in bulk to make it cheaper and to save time. However, this was not the optimum strategy. A weekly shop and meal prep is better.
Here are some snapshots of those calculations: ( if on desktop, right click to open larger image in new tab)
Conclusion
Continuous effort with continual tweaking based on feedback is key to seeing results. There is no quick fix here. Understanding the reward response mechanism of the brain will also help in identifying your weak areas. Is it motivation? Is it eating too much / too little? Is it amount of effort you put in whilst training? You don’t need to shell out on fancy gadgets or equipment. Most gym clubs have machines that can give you the necessary body readings, you just need to put it into your excel sheet.
Personal Training by Paul Guillermo at Platform 3 Fitness, Dubai Marina (next to Moms Food, under the Park Island buildings)
2 notes
·
View notes
Text
Snapchat Discover - impact on brands in the Middle East

Snapchat’snew “Discover” feature delivers more value to users of the chat app and can keep them engaged, but how will this affect regional audiences? Publishers cannow reach the highly desirable under 25 crowd on their terms of immediacy, fun and a novel format at the core of their terms; but will Middle Eastern brands be able to compete with international media powerhouses, or will they seek to engage power users to spread their message?
Unless you’re under 25, Snapchat may be a complete mystery to you. Yet another messaging app which has caught on with the teen crowd with the main draw being the lack of lasting information. The option to be able to continually stream parts of your life and have those moments disappear as fast as they get produced is a lucrative option for the 61% of Saudis that according to KPCB, have no problem sharing everything online (source: KPCB Internet report 2013).
Chatting apps range from the extremely minimal (WhatsApp) to the packed-full-of-features like content, gaming and banking (WeChat). Whilst most agree that users will not use just one app, the trick is to take more share of attention, which is why the new Discover feature launched by Snapchat this month is exciting. Snapchat processes more than twice the number of photos than Instagram.
Currently Discover is an additional page within the app which serves as a jump off point to discover more content from media powerhouses. This content will have a truncated shelf life, like the rest of communication on the app. After a certain amount of time, it will no longer be available, thus encouraging users to check in routinely

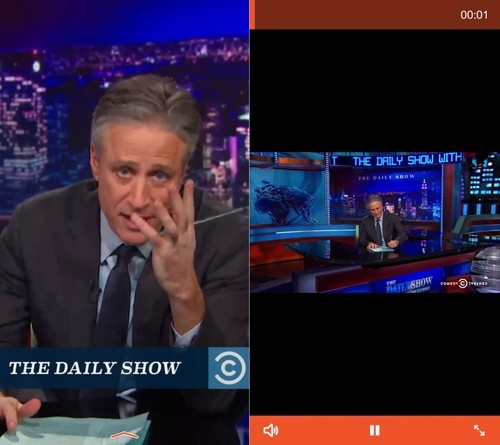
I’ve used Business Insider’s screen shots for quality purposes
Tapping on the Comedy Central logo, for example, brings up a video clip from The Daily Show. If you want to see the full video segment or article attached to a Story, just swipe down and it'll expand.
Snapchat Discover also includes ad integration, so each media channel includes a sponsor, and sponsor ads are often included in their story channel too.
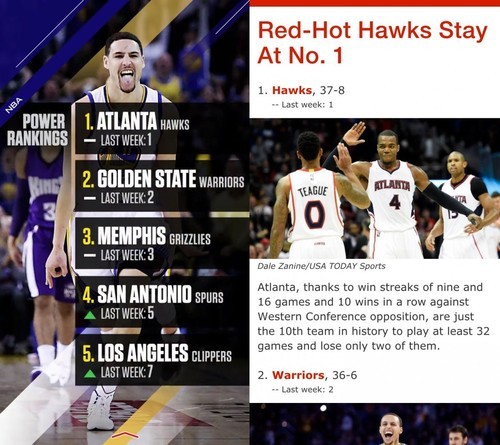
An example of ESPN's Story channel. Once you're in a channel, a user can swipe to the right to cycle through the available stories and videos.

The same swipe-down method also works for text-based Stories, such as this ESPN article on the NBA rankings.
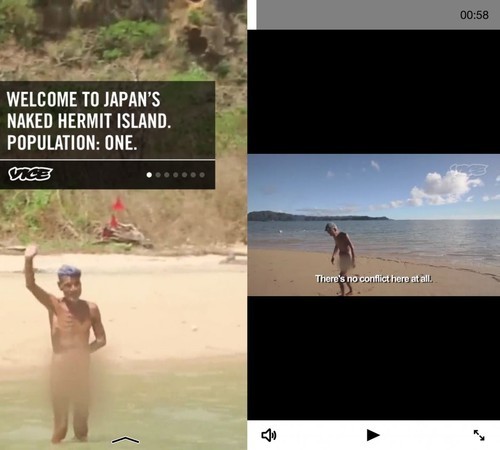
Here's what watching a Vice documentary looks like.
The Yahoo News channel includes an intro with Katie Couric.

Snapchat in the Middle East:
SimilarWeb reports that Snapchat reached number 2 in the app charts for Saudi and the UAE last year, and still maintains a strong growth rate in Saudi amongst other markets like Latin America.
We’ve seen sites such as Net a Porter cater to their Middle Eastern crowd by doing special events or partnerships; recently NAP partnered with QNB bank in Qatar to deliver an evening of fashion with sneak previews and a presentation by NAP’s global sales and marketing director. Group chatting app Palringo, which has the majority of its monthly active users in Saudi and the UAE added in mobile gaming to better cater the needs of its users.
It’s natural to expect that Snapchat might want to consider localizing swiftly for this growing market, by potentially opening up advertising against the existing content or allowing local media to feature on Discover. With advertising coming in at $750,000 per day however, this may price most regional brands out. There hasn’t been any information yet on the cost of featuring on the Discover page.
As it stands, the current Discover content serves to strengthen existing brand awareness for regional consumers, perhaps making them more attentive to engage with their stories on other platforms. There is no linking to the brand’s content off site, so we may expect to see more search activities, for which Google will benefit in ad dollars. If certain content is blocked by Middle Eastern ISP’s whilst searching; this will further strengthen Snapchat’s positioning as a media hub and keep users engaged.
The trend of adding in content to devices, (preloaded apps on smartphones) apps (Snapchat) and platforms (Xbox) continues to grow. However, not all of these deals work for all regions. Much 3rd party content within Apple TV for example can only be accessed whilst in America or Europe. Publishers wishing to remain top of mind with global consumers will have to ensure their content is licensed in multiple territories on multiple platforms and consider the potential of censorship. Conversely, apps such as Snapchat may have to quickly work with local content providers to ensure they themselves don’t get blocked. Tinder for example has been blocked in the UAE, allowing the app to load, but without any of the images. Viber was also blocked by several GCC states a while ago.
One can easily imagine that a regional Discover page might include content from MBC, Fox News, Citruss TV Shopping Channel, Arab Idol, National Geographic Abu Dhabi, CNN Arabia and SkyNewsArabia. Aseer News (a research house in Saudi) recently performed a survey on 30,000 Saudis aged 15 – 35, and found that 40% of them prefer to read the news online, which suggests that more local news content on Discover would be a good strategy.
These types of media as well as the existing brands on Discover, are already known to brands and therefore should attract advertising. In this case, Snapchat would keep a portion of the ad revenue. However, the model is similar to Facebook’s recent proposal to publishers in which it offered to host publishers’ stories within the app (keeping them within Facebook not driving them off site and speeding up load time) and give publishers a cut of mobile ad revenue in return. This was not well received. As readers have gone mobile, Facebook has taken advantage, in the short term mobile ad revenue could increase, but brands don’t want to outsource their ad sales completely to third parties. In addition, should Facebook decide their interests are no longer aligned with those of the publishers, (as in the case of Zynga) they will be left high and dry.
Conclusion:
It has been said that, “the only way to make your brand's Snapchat worth caring about is to make it change every day and make your brand an evolving story. That means new experiences daily and having these experiences build out a coherent brand personality”.
Advocates also point to the fact that unlike Instagram, “Snapchat isn’t about pretty pictures” thus the brand has an opportunity to be more authentic capturing more real life content that is supposed to resonate with the target audience. But in emerging markets such as the Middle East, glitz, glamour and a pretty image are highly sought after by brands and consumers alike. Aspirational mindsets are not age specific. A Nielsen survey found that consumers in the Middle East are amongst the most impulsive and brand-conscious shoppers in the world. The affinity for buying famous brands is also highest among consumers in the region (56 per cent) and nearly half (43 per cent) tend to get their hands on new products ahead of other consumers.
Regional brands may simply not have the cash (for advertising or featuring on Discover) or human resources to spend on Snapchat to make it an effective marketing channel right now. Brands may also be wary of investing in a platform that could shortly be banned by local regulators. Locally, Al Hilal Bank, W Hotel Doha and Buro 24/7 (an online content portal) have already added Snapchat to their social media presence within the last 2 months. Has this presence generated an increase in customer acquisition or improved KPI’s in terms of customer service? It’s too early to tell. What is key though is that users won’t know about brand’s presence unless the Snapchat account is broadcast on other channels. Brands that already have healthy and visible marketing channels will benefit the most.
If the regional performance of Instagram is anything to go by, greater success can be found by finding viral stars of a network and working with them to promote products to their own following. Power users who take snaps with certain products or at particular destinations, co creating specific promotions are potentially a better way for brands to take advantage of this medium. In order to generate new content daily, brands will have to leverage these individuals as they generate infinitely more content than a brand can.
As a final thought, it might be useful to ponder that as fast as new platforms experiment with content, and as numerous as these platforms are, it is always the same handful of brands which are the early adopters and are able to integrate their messaging. These are brands which have the money and resources to innovate with an unproven medium. Outcomes are an exponential increase in available touchpoints, but a decrease in breadth of available content, where information is managed by a few players. This isn’t terribly different to the old media model.
3 notes
·
View notes
Text
Will Instagram will work as a direct path to purchase for Middle East Retailers?
Instagram is most used in the GCC by brands wanting to increase awareness and community building, particularly in the lifestyle, FMCG and food sectors. The popularity of Instagram amongst local users should not be underestimated. Saudi users number about 8.8 million (approx 50% of the Saudi Internet population) and UAE users number roughly 2.1 million (approximately 22% of the UAE internet population).
The following table of Penetration Rates shows users of each channel expressed as a percentage of the overall Internet Population:
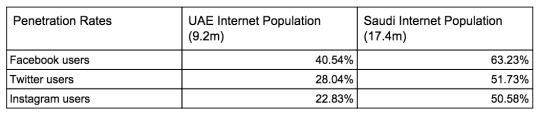
With such an engaged audience, the opportunity for commerce is high, however the inability to add hyperlinks in individual posts on Instagram prevents users reaching checkout easily.
Using SimilarWeb to analyse site traffic for 9 regional ecommerce brands, Search, Direct and Referrals were typically the highest driver of visits, with an average of 10% or less traffic coming from all Social Channels. Of that 10%, roughly 80% is accounted for by Facebook. Despite a low percentage of overall site traffic coming directly from Social Channels, the value of that traffic to the CMO is important. There may be fewer site users originating from Twitter for example, but the average checkout amount per user could be higher compared to those that visit the site directly. Users coming from Search channels may need more retargeting before they eventually checkout, thus requiring more budget spent on assets, whereas users on Instagram might spontaneously buy, meaning cost per acquisition is lower.
Whilst we don’t have access to each brand’s analytics, we can make some assumptions based on engagement rates. A recent Forrester report found that brands on Facebook only generated 0.07% fan engagement, and brands on Twitter only generated 0.03% engagement from followers. Brands on Instagram, on the other hand, had an engagement rate of 4.21%.
If we look at the number of followers for these brands across channels, the opportunity for brands to monetize their engaged Instagram followers becomes clear using Forrester’s engagement rates:
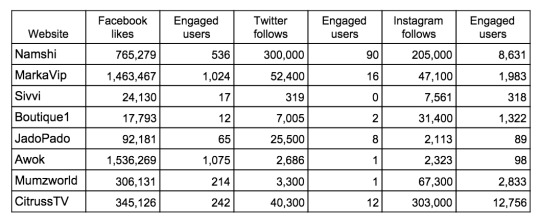
Instagram appears to be the perfect channel for stimulating ecommerce. Given that it is purely a platform for images, there can be no better way to showcase a retailer’s goods. The research firm L2 found that Instagram has the best conversion rate of turning a casual browser into a shopper. The report also found that this is particularly true for luxury brands that post an average of 5.5 times a week, with 92% of them generating more customers.
Importantly, users on mobile prefer to stay native, meaning whatever platform they are using, they don’t want to leave it and come back to it later.
Several applications have solved this problem by building on top of Instagram’s API. Like2Buy from Curalate is one of them. The current single hyperlink in an Instagram bio takes a user from a highly focused image of a single product (ready to purchase) to the homepage of a website, reversing the purchase funnel. Like2Buy solves this problem by replicating the brand’s photos on their page, but each one of them now being able to link directly to the exact product page on the brand’s website. Importantly, whilst a user is in that interstitial step, she still feels like she’s within the Instagram app. An added bonus is that if a user has liked particular photos from that brand’s Instagram feed, these will show up on the Like2Buy page in a separate column.
The American accounts of Bath and Bodyworks, Victorias Secret and Saks all use LIke2Buy however, their Middle East counterparts don’t. They don’t even link to an online store. BBW Mena has a link to the store locations on the Al Shaya website and Saks Middle East has a link to a Youtube video.
Curalate reports an 80% increase in click-through rate from the Like2Buy page to product pages, when compared to a regular link. Studies also show that users who visit a company’s mobile site via their Like2Buy page also tend to spend more time on the site than typical mobile users.
Soldsie is another service that captures impulse buying on Instagram. You can simply comment “Sold” with your email address on a photo and the app sends you an invoice for that product to your email. From that email you then click through to the checkout page on the brand website. The downside of course is that everyone can see your email address. Soldsie claims a 70% conversion rate and 60% of transactions happen after 30 minutes.
Inselly aggregates Instagram photos based on hashtags and makes them searchable by Instagram users. Brands connect their Inselly account to their Instagram account and apply #inselly to their photos. These get replicated and aggregated in an Inselly “store”. Once the Inselly link is set in the bio followers can click on it to shop items. Brands get paid through Paypal.
All these services are designed around the behaviours of Instagram users, and focus on reducing the amount of clicks to purchase. Instagram is essentially the shop window for retailers and local brands should treat it in a similar fashion, expecting to pique user interest and capture impulse buying. More importantly; for local retailers with either little expertise or resources to invest in building their own ecommerce offering, these SaaS platforms allow a quick and easy setup that can be managed by marketing departments or their agencies.
#fashion#lifestyle#middle east#dubai#kuwait#shopping#ecommerce#instacommerce#instagram#like2buy#curalate#soldsie#getcandid#inselly#shopstasy#strategy#digital#2015#sales#startups#sme
1 note
·
View note
Text
Payment Gateway Costs UAE, October 2014

How much will it cost me?
Just over 2 years ago, in June 2012, I did a brief, top level summary of payment gateway options and costs in a presentation at the MAKE business hub, and I shared it online. Although it was fairly superficial it has received over 17,000 views to date.
I hope to be more useful with this updated edition, which includes a wider range of gateways, more detailed costs, and a link to a working spreadsheet which shows details in full.
Go straight to the spreadsheet on google docs http://bit.ly/paymentsUAE
Gateways looked at:
2Checkout
Network International (NI)
Telr
Payfort
Checkout.com
Paytabs
The first thing most people look at is the per transaction percentage cut the gateway will take.
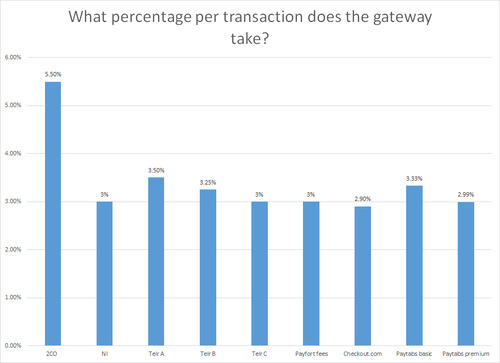
According to this graph, 2CO is the most expensive, so we should avoid it. But this graph doesn't tell the whole story.
As you will no doubt be aware, the 3 banks permitted to process credit card payments in the UAE; Emirates NBD (NI), Mashreq Bank (Payfort) and National Bank of Abu Dhabi (?) tend to require large security deposits. These have to be factored in when thinking about operating costs.
In addition, there are monthly fees, setup fees, and any other additional fees to work into any caluclation.
There are also the fixed costs per transaction that some gateways levy, for example, 2CO takes 5.5% plus a fixed 1.65 dirham fee every time someone purchases.
Some payment processors, like Telr, offer a tiered approach, where a higher per transaction percentage comes with a lower monthly fee (eg 3.5% and a 150 AED monthly fee) and a lower per transaction cost comes with a higher monthly fee (3% and a 500 AED monthly fee)
Finally, as with many service industries in this region, it is hard to generate an exact consistent price across the board for certain things because it depends on who is dealing with whom, what type of business you have and the particular attitude of the person on the day you make the application. Bank deposits can range from $30,000 (USD) to $50,000 and even more. For this exercise i have used $30k and $50k to be able to compare.
(excerpt from spreadsheet)
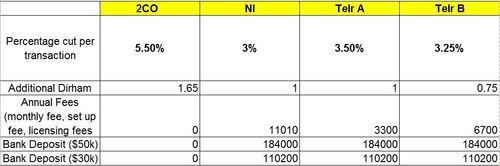
Once we have these costs, we can then manipulate them into more real life examples, by amortizing the costs over one year (to generate a PCM cost) and inputting assumed sales units for one month.
(excerpt from spreadsheet)
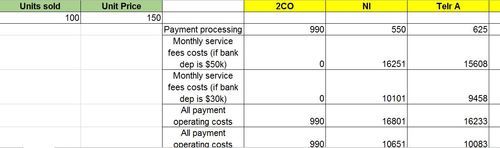
If we then put in a cost of 20 AED per item for delivery charges (Aramex costs for shipments up to 5kg), we then end up with a table which gives us total cost of retail goods, payment processing fees on those goods, and the operating costs of the banking and payment processors along with the logistics fees.
We can then see what we are left with at the end of the month per gateway and the results are incredibly different
Visit the spreadsheet here: http://bit.ly/paymentsUAE
If you don't have a "to the penny" marketing plan, or you are a startup, its best to err on the side of caution and assume very few sales at the beginning. You would need to generate several thousand hits to your website and have high conversion rates to be looking at over 100 sales a month. This will not be cheap. In fact, since most of your money will be going to acquiring customers, you want to spend as little as possible on processing the payments from them.
What i haven't included in here is the extra 50 - 100 AED per month you might need to spend in transferring money from the processor into your account; eg from 2CO, checkout.com. Payment gateways also can apply their own currency exchange before transferring the money to you at a higher rate than normal, so that's something to watch out for. If you are using local bank processor (NI, Payfort etc) they will pay straight into your account.
There are a few more options to add like White Payments and Hyperpay which I will be doing in a later post at the end of January 2015
Visit the sheet and let me know if any updates to the fees required here: http://bit.ly/paymentsUAE
9 notes
·
View notes
Text
Dubai Transport, Dubai Taxis and Salik data

I started looking at some numbers reported in the press about the increased use of public transport in Dubai.
7days reported that “367 million journeys were made in 2012” compared to 346.5 million in 2011 across all forms of public transport (buses, water taxis, metro and road taxis)
Khaleej Times on the other hand, reported that “367.567 million passengers used public transport in 2012” compared to “21.157 million in 2011”
The difference between passenger and journey is important, as another 7days article in July of 2012 reported on the statistics during H1 2012, stating that “taxis made 47 million trips serving 94 million passengers” meaning that each trip serves on average 2 passengers.
Here is a table showing the figures reported in the media. Numbers in black were stated in the media, numbers in red were calculated by process of deduction.
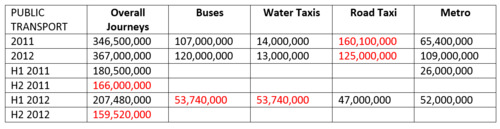
The following table shows difference in reporting the Dubai Taxi trips between RTA Annual Report from 2011, RTA Q1 2013 report and AMEinfo
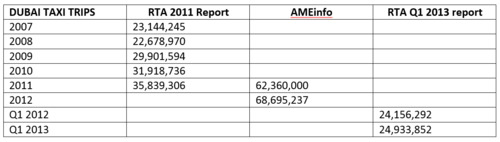
AMEinfo reported that Dubai Taxi trips in 2011 were 62.36 million and in 2012 rose to 68.7 million. Quoting the number of passengers these trips served, we get to an average of 2 passengers per trip again.
The AME taxi trip info is interesting because if you look at the Annual Statistics Report of 2011 from the RTA their 2011 taxi trip numbers are only 35.8 million, meaning that AMEinfo figures are 74% higher than RTA published figures for 2011 regarding Dubai taxi journeys. How is this possible?
The 2011 annual report from the RTA states the number of Dubai Taxis as 3504 in that year, however upon looking at the Q1 2013 report, it appears that they haven’t included the other licensed Taxi Cab operators such as Al Watani Taxi, Al Arabia Taxi, Metro Taxi, Cars Taxi and Al Madina. This means that the Q1 2013 taxi fleet stands at 8042. However, the total trip data for 2011 in the 2011 report does include the journeys from all licensed taxi operators.
On the RTA website (www.rta.ae ) they state 26 Ladies Taxis are available, but on the Q1 2013 report, it states 50 are available.
Compared to the same period in 2012, there has been almost zero increase in the number of total taxi vehicles available. I haven’t managed to pull off population and tourist figures for these time periods for Dubai but I’m pretty sure there will be an increase, meaning there are probably more people but not a corresponding increase in number of vehicles to serve them.
SALIK
If we take the number of trips from the Q1 2013 RTA report for taxis at 24,933,852, this works out at an average of 8,311,284 taxi trips per month. There are 6 Salik gates in total, obviously some will be used more than others. No Salik revenue is ever reported but we can play around with some figures like so:
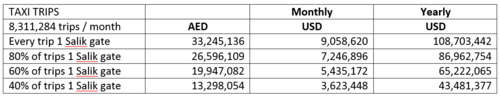
If we look at the reported number of licensed vehicles again from the same report, in March 2013 we can see that there were a total of 1,167,170 vehicles (including motorcycles, cars, trucks etc).
Let’s remove the 8042 taxi cabs from the total since we have accounted for them in the above table. That leaves us with 1,159,128 vehicles. Many of these private vehicles will have to pass Salik gates. I’ve used a figure of 25 days for the “monthly” figures, so this is probably a conservative estimate.
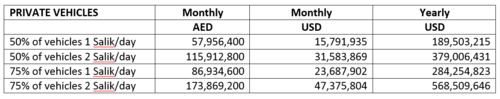
Of course there are any number of permutations of these data points, and depending on which data source you decide to use for just the number of taxi trips, you can generate an even broader range for revenue, but just taking the smallest and largest figures from the above 2 tables, Salik could generate anywhere from $232 million - $677 million per year. I believe something around the $500 million / year mark would not be a bad guess.
The last time I spoke to a taxi driver he said their daily gross target is 450 dirhams. If we assume all 8042 taxis are operating daily, that means just over 3.6 million AED has to be generated daily. ($986,000).
Monthly that would mean a gross total revenue of almost $30 million, take away the $9 million in Salik fees (if every taxi trip passes under 1 Salik gate – see above tables) that means almost $21 million / month in revenue to the taxi corporations (before subtracting other operating expenses such as salary, maintenance etc).
RTA describes the breakup of the total number of vehicles and trips by each taxi company, for Q1 2013 as follows.
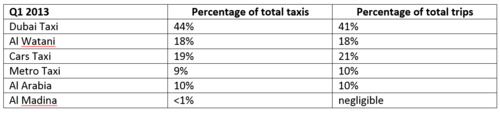
Using the total trip percentages, we may get a monthly revenue after Salik per company as follows:
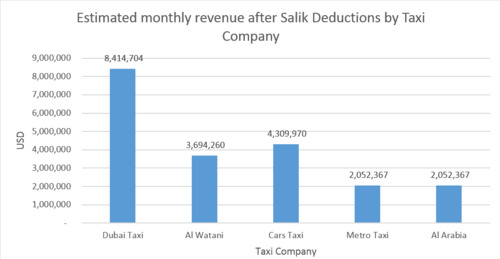
What can we conclude from the above exercise?
We are aware that media coverage of industry and government statistics tends to be misquoted at best and wildly inaccurate at worst. The reports from the relevant government bodies are also inconsistent, I couldn’t find the Annual RTA report for 2012 for example. It’s not made clear if the same reporting methods are used in each year as well. Within reports, there is some misleading data (for example the 2011 count of only Dubai Taxis, but the total trip count including all taxi corporations)
For the average taxi user, it might be useful to know that there are only 8042 taxis available and that number hasn’t changed since last year, this could help when planning journeys or considering other public transport options. For ladies who require female drivers, 50 taxis out of 8042 is rather a low percentage, in fact Ladies Taxis make up 0.6% of all available taxis. Is there an opportunity for Careem and Uber to capitalize on this opportunity?
0 notes