#elevation map
Text
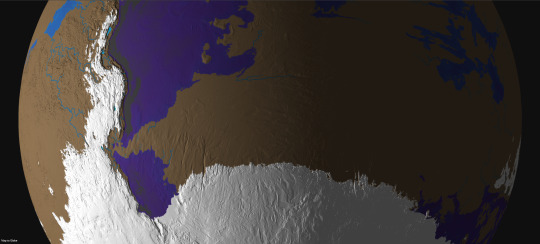
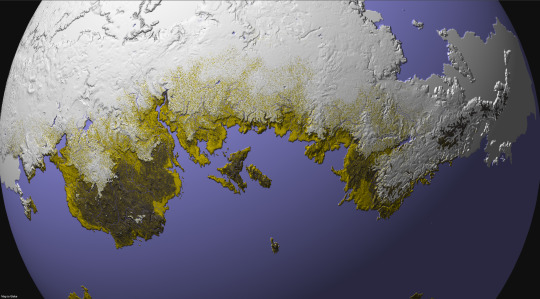
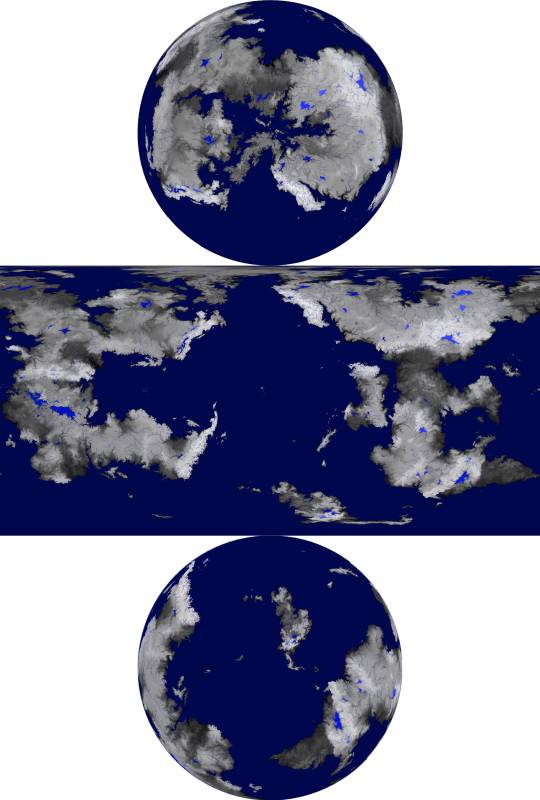
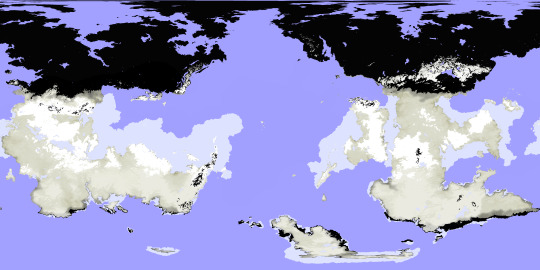
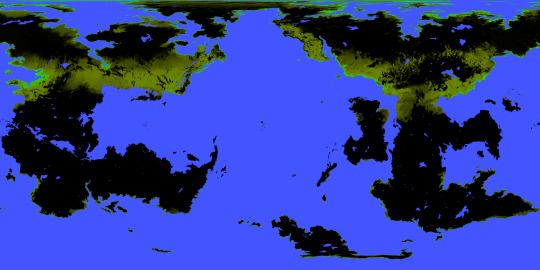
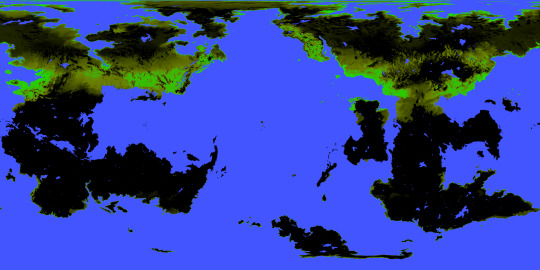
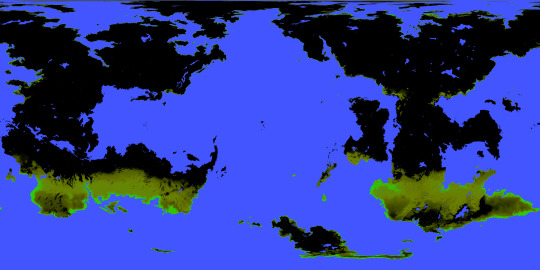
This third series of maps for @jayrockin‘s “Runaway to the Stars” project represent the planet their Bugferret alien species calls home, a cold, seasonless world with much of its water held up in immense ice sheets and extensive cave systems. As such, a great deal of this world’s oceanic crust is exposed to the air, concentrating what little seawater remains at the subduction trenches and other extremely old, low-lying portions of crust.
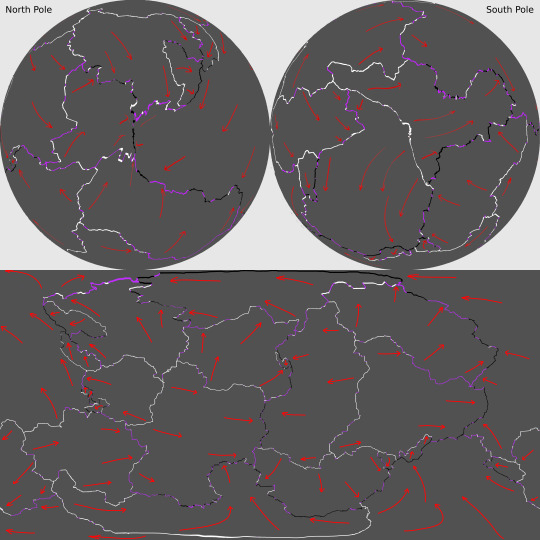
First, the planet’s plate tectonics, with the plate boundaries defined in white (for divergent boundaries), black (for convergent boundaries), and purple (for transform boundaries) and the directions of drift marked by red arrows, in Equirectangular Projection and Poles-Centered perspective.
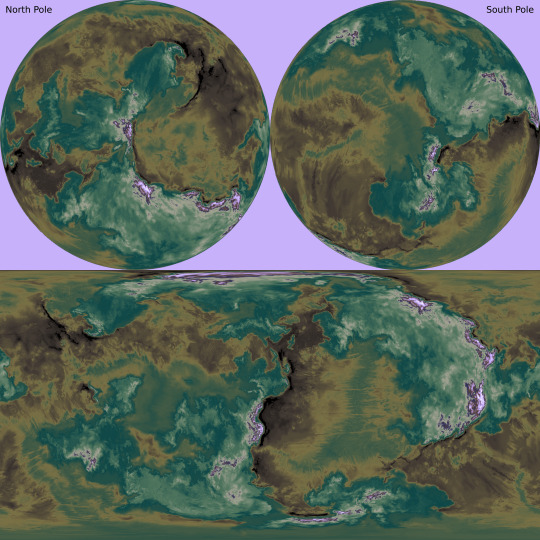
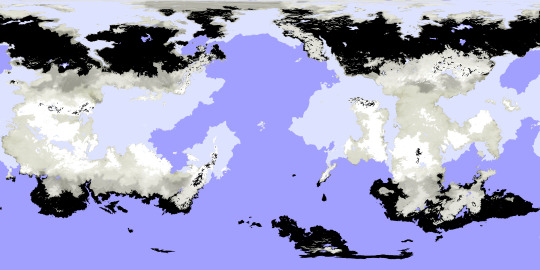
The maps below show the planet’s elevation data, first in grayscale with no color gradient applied, in Equirectangular Projection and Poles-Centered perspective;

then with the color gradient applied, also in Equirectangular Projection and Poles-Centered perspective;
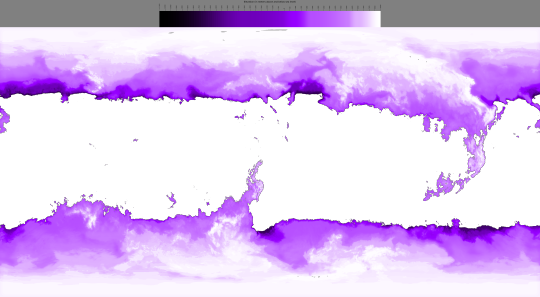
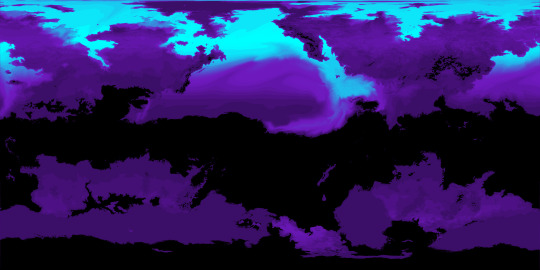
and then with the color gradient once again removed but now showing the planet’s liquid water, in Equirectangular Projection only.

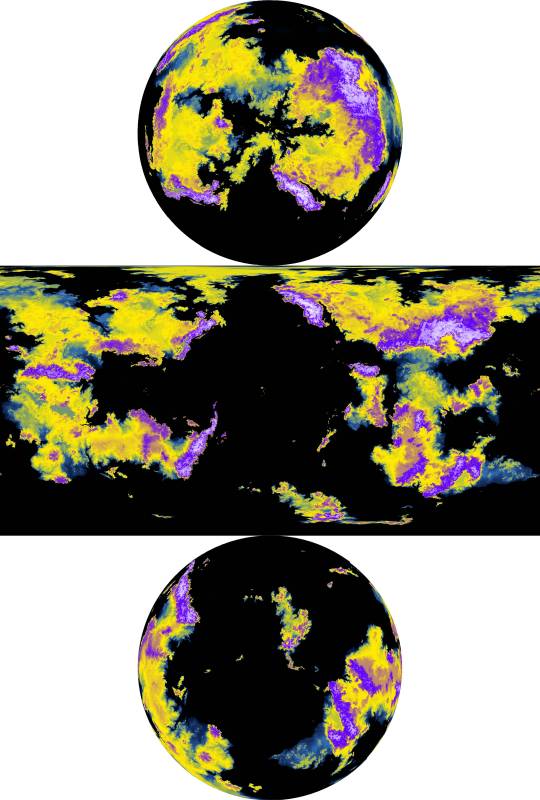
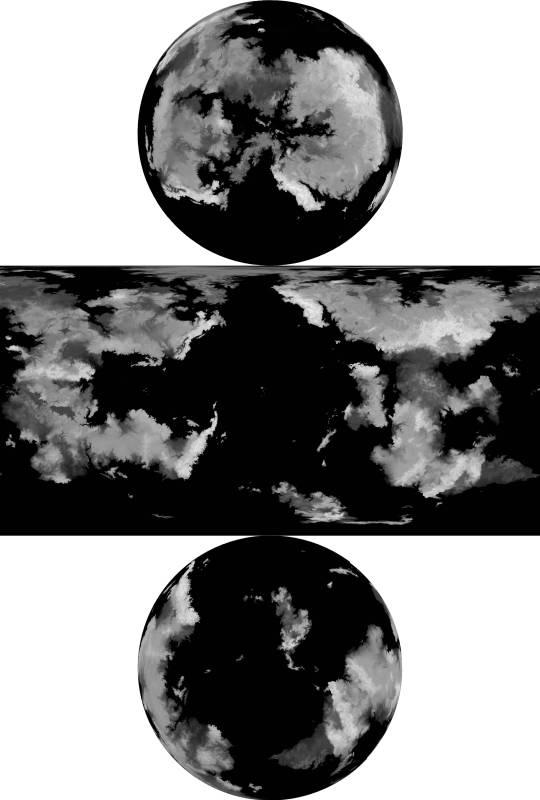
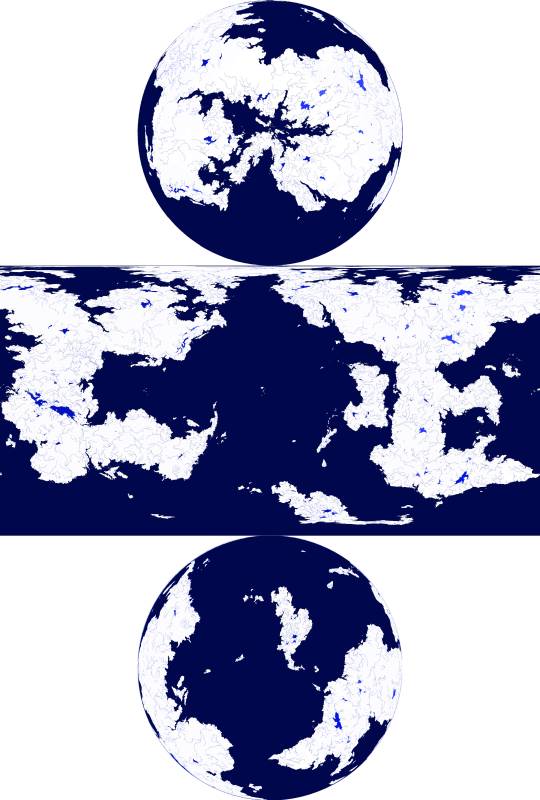
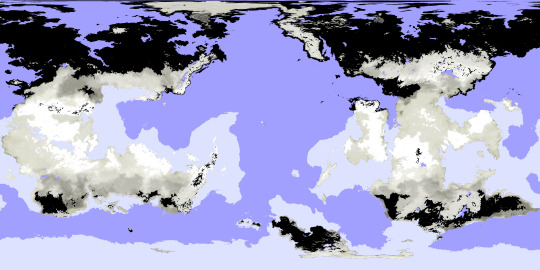
The second phase of this commission focused on the planet’s ice sheets and the liquid water hidden beneath it them.
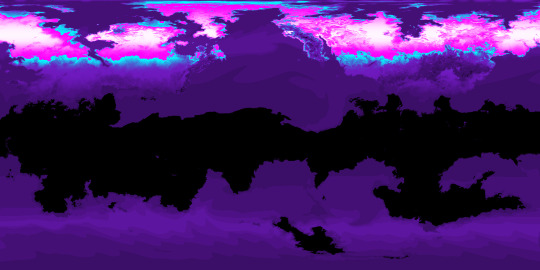
First, there’s the raw elevation data for the ice in relation to “sea level” -with no contiguous ocean to define this, it is instead defined as 200 meters above the average continental shelf’s edges, correlating to Earth’s own sea level-, along with a key, in Equirectangular Projection;

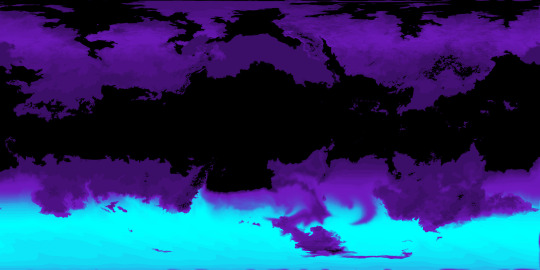
then, the same data with a color gradient applied;
and again, this time also showing how many meters of ice sit atop the subglacial bodies of water;
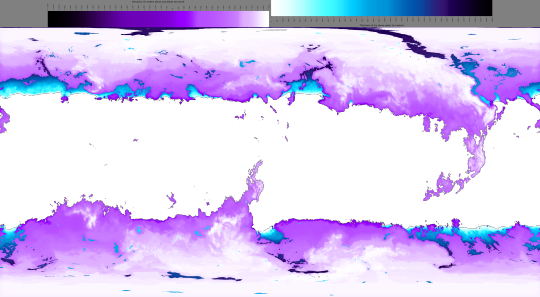
and lastly, the thickness of the ice over land as well as water, first in grayscale;

and then with a color gradient applied.

The thickest point in Earth’s own ice sheets is 4,776 meters deep, just a fraction of the Bugferret planet’s maximum of 18,000 meters between the top of the ice sheet and the trench-sea hidden beneath it.
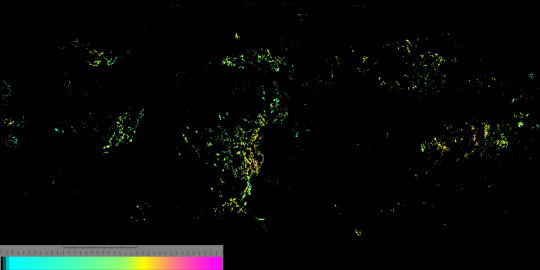
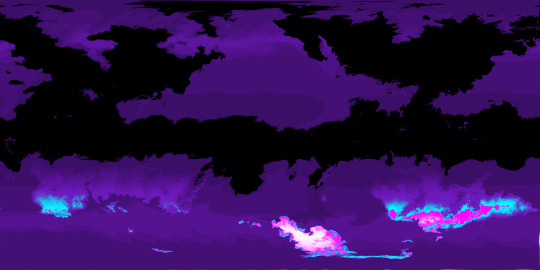
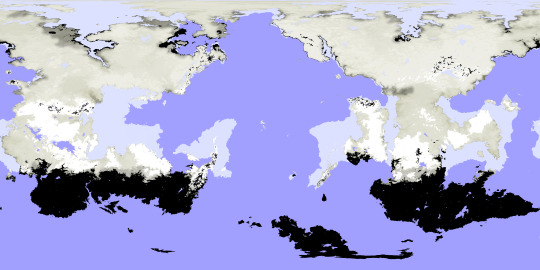
The map below shows the volcanic activity on this planet. Volcanoes marked in pink have erupted in the past millennium, and those marked in white have erupted in the past 300 years Looking back to the ice-cover map that also shows the subglacial water, you can see how some of those lakes are caused by recent eruptions, as are the few ice-free mountain peaks in the higher latitudes.

Lastly, the third phase of this project mapped out the cave systems, expanded tremendously both by modern Bugferret activity and previous eons of dissolution and upheaval by organisms more comparable to fungi, plants, and burrowing detritivores.
The first map below shows all of the major caverns combined into one layer, color-coded by vertical position in relation to the so-called sea level, instead of depth beneath the local surface.
I mapped out these caves in four overlapping layers, here color-coded to represent the tallness of a given chamber. The first of these layers contains those caves closest to the surface;

a bit further beneath the surface;

further down still;

and the lowest layer of all, with its shallowest caves sitting no less than 8,500 meters beneath their local surface.

All the caves shown here can be accessed from the surface, either directly or in connection to other caves, even if the connecting passages are too narrow to be visible at this resolution. Some of these connections can be fully seen or at least suggested in the cross section below, showing the vertical positions of the caverns beneath a mountain range, or a small slice thereof.

This cross section is shown again with a map that marks its location, and that also includes the ice sheets, subglacial and exposed liquid water, and combined caves.

These maps were all created in Photopea. My reddit post dedicated to this project, wherein you can see the highest resolution versions of these images, is linked here.
2022
#runaway to the stars#mapmaking#imaginary maps#worldbuilding#commission#digital painting#photopea#Bugferrets#fictional planets#elevation map#color gradients#ice maps#liquid water map#cave systems#major project#alien planet#Christopher Maida Artwork
60 notes
·
View notes
Text
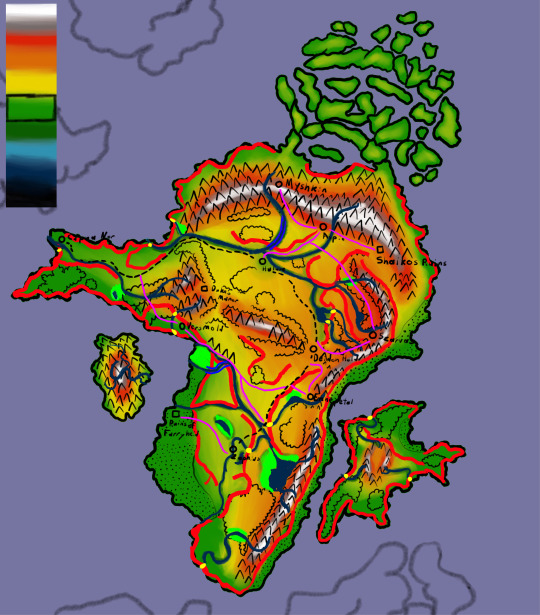
A (very quick-and-dirty) elevation map of Ilyccia continent that I'll probably revise once I've got all the symbols drawn in properly. It's all still a bit slapdash, but I'm decently proud of it.
The shade of green with the black box drawn around it in the upper left is supposed to represent sea level.
6 notes
·
View notes
Text
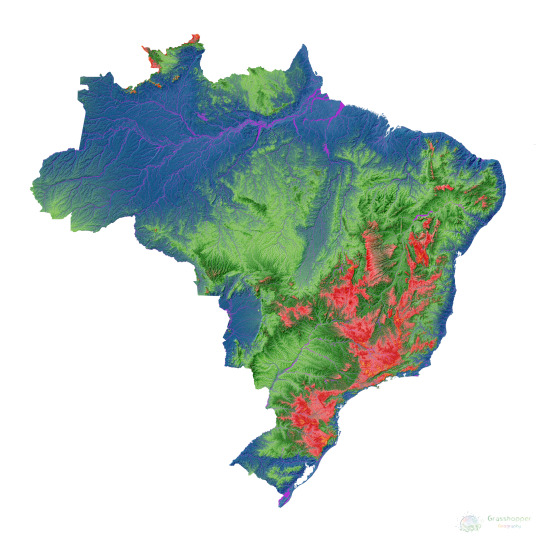
Elevation map of Brazil in unique colours.
Read more and buy prints here.
Ko-fi | RedBubble | Etsy (digital prints)
#elevation map#relief map#maps#geography#artists on tumblr#cartography#my art#digital art#wall art#map making#independent artist#brazil#brasil
2 notes
·
View notes
Text
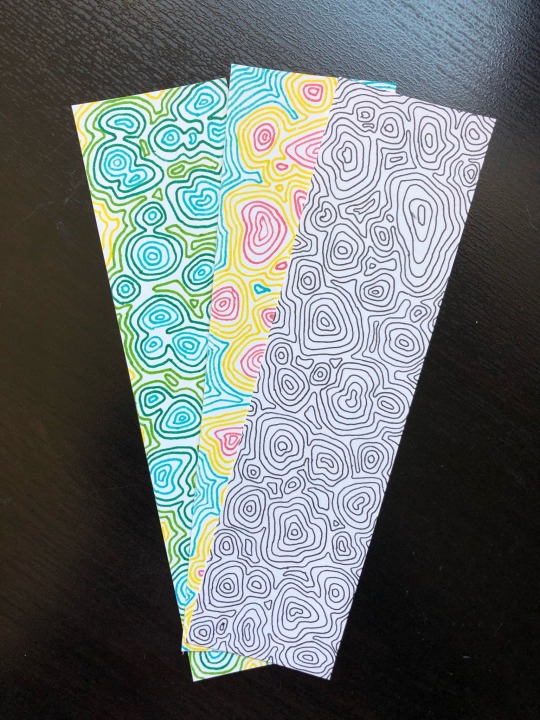
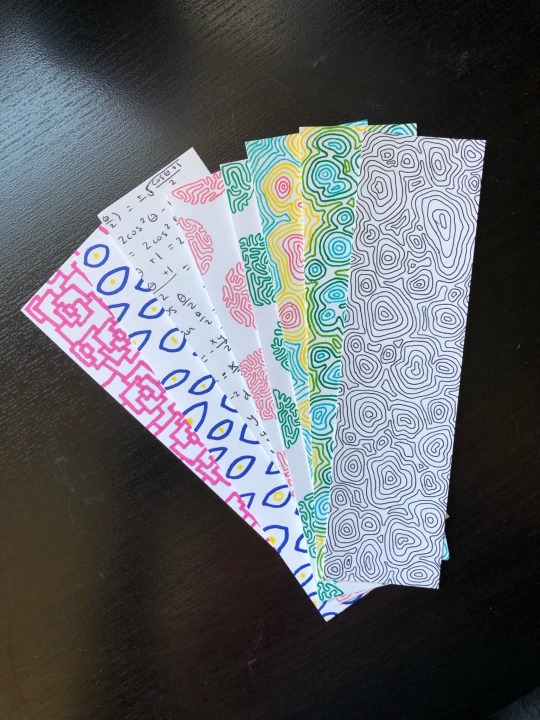
color options for a new topography map inspired design! I’ve really been enjoying this pattern, it reminds me of island chains. now available on my etsy!
#bookmark#etsy#etsy shop#etsy seller#bookmarks#elevation map#fantasy map#map art#maps#map doodle#placeholder bookmark#topography#topography map
1 note
·
View note
Photo
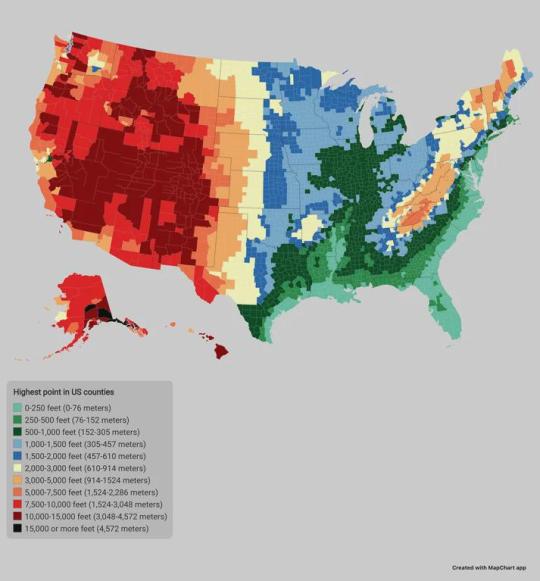
The highest point of elevation in each US county
219 notes
·
View notes
Text
I'm in desperate need of an arthur returns fic that begins like five years after the fact, when arthur has fully integrated into modern society and him and merlin are married and living normal 21st century lives. only to out of nowhere get sent back in time to when they first met in camelot. so now they have to redo it all while pretending that they aren't essentially millennials with twitter brainrot going insane from caffeine withdrawal
#merlin#merthur#arthur would be such a whiny bitch about it im crying imagining it#“why is everything so uncomfortable to sit on. merlin can't you just magic us a couch”#they get lost on patrol and merlin automatically goes to take out his phone to check Google maps and then gets an aneurism when he remembera#people overhear them speaking in modern english and are incredibly confused#“i would murder a man with my bare hands for sugar right now”#elevators and escalators are mourned like loved ones
161 notes
·
View notes
Text

i never ever want to visit the planet Zeffo again in my lifetime.
#jedi fallen order#cal kestis#zeffo#My god#the elevator was right there like Right on the map why cant i just go in why do i have to push magic force balls#unhelpful bd-1#jedi survivor
74 notes
·
View notes
Text
NOT proud of the way my accent turns "kansas" into a three-syllable word.
#context is i had to find that post about completely flat and level kansas after seeing an elevation map on some slides for a class#shebbz shoutz
81 notes
·
View notes
Text


Rates of Travel by rail in the United States, Atlas of the historical geography of the United States, 1932
#Rail Travel#Railroad#trains#locomotives#maps#it's like a elevation map but travel times#vintage#historical#us history#Hide and Queue
84 notes
·
View notes
Text
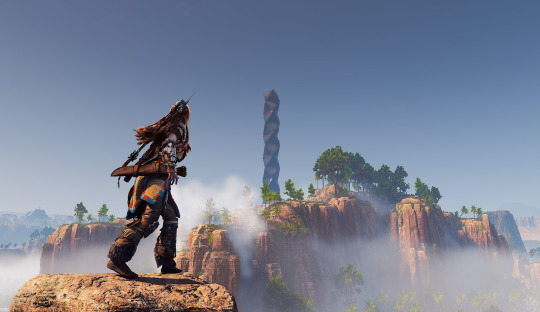

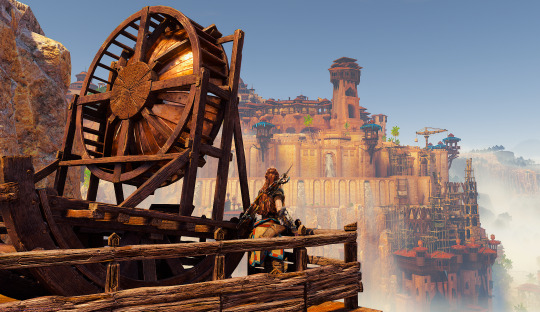
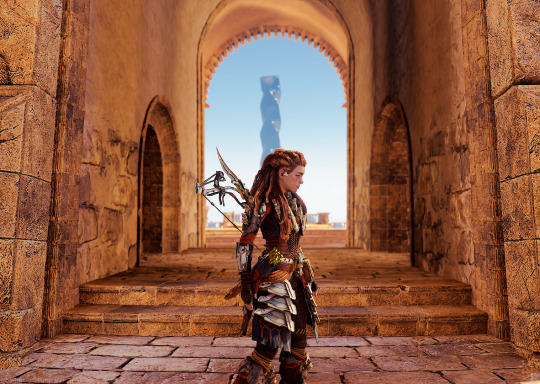
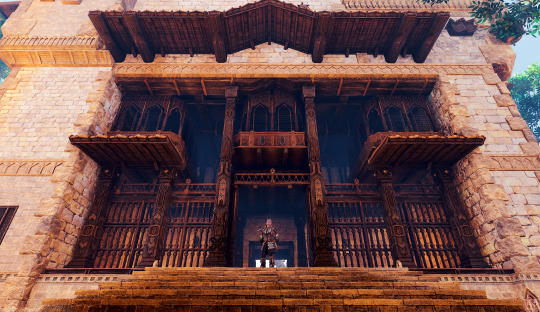
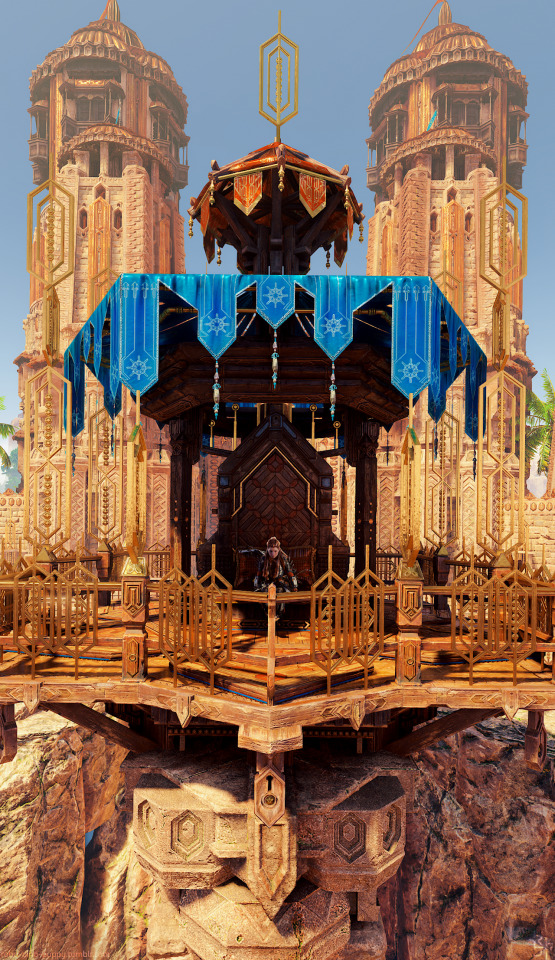
return to meridian
#horizon forbidden west#hfw#aloy#hfw out of bounds#out of bounds exploration#ok i know i said the first thing i'd do was THE FORT but.#you can't just wander around there (yet?) with the mod (accursed 'you can't enter this location' message)#and i want my pics to do it justice#so consider this offering of the spire and meridian instead :D#there's definitely some funky textures going on in spots#and there are still some invisible walls around the spire (you can get through them with the free cam/teleport tho)#and i eventually went so far i seemed to break the map with a shader compilation loading screen lmao oops#but in the meantime these are cool#the hunter's lodge has no floor or anything else#and there are a number of holes in the ground in the city (i guess they're still doing construction XD)#and there are no elevators and the water isn't real so you don't float in it#but otherwise it looks surprisingly complete#hfw pc#(remove reload boundary mod)#hfw meridian
53 notes
·
View notes
Photo
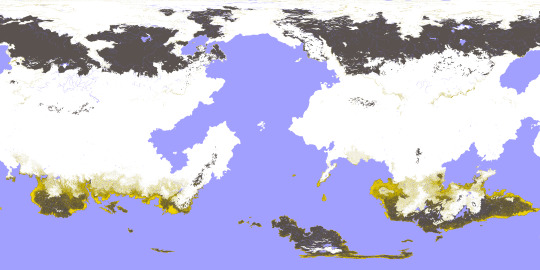
Some months ago, I created a series of maps and diagrams for @iguanodont‘s Birdbug worldbuilding project, representing the planet inhabited by their original species and its planetological data. This isn’t the first time I mapped out this planet, as I was also commissioned by Ripley back in 2020 back when I didn’t have nearly as much experience and knowledge as I do now. Two years later, I’ve been commissioned once again to revisit this world and its peculiarities.
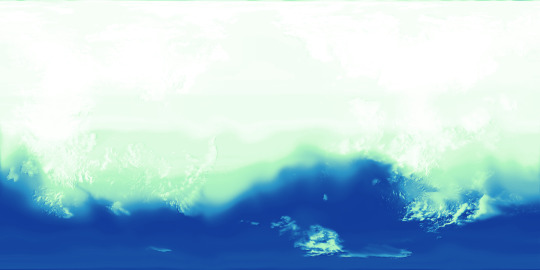
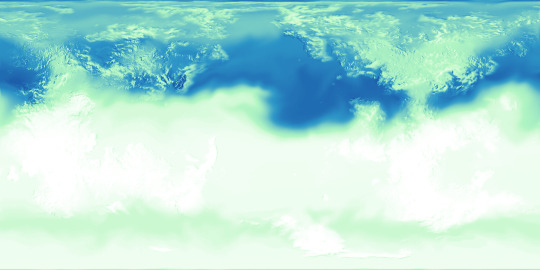
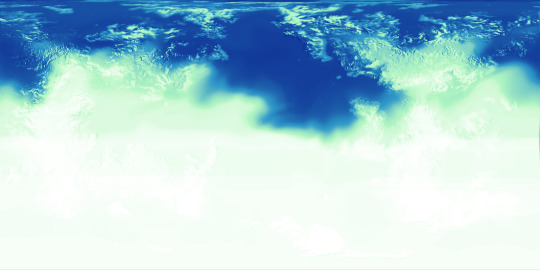
This first map (in Equirectangular projection and poles-centered perspective) depicts the elevation for this planet, with a color gradient applied to the data.
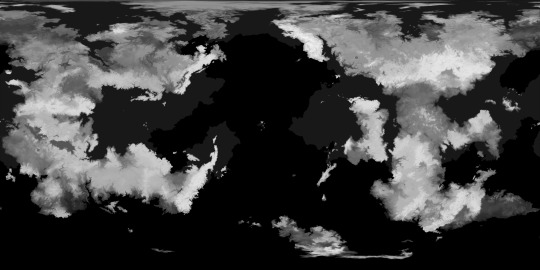
Here is the same elevation data, presented without the color gradient.
This time, the elevation is presented with bodies of liquid water included, such as rivers, oceans, and lakes.
and in this one, the water is isolated from the other data, against a white background
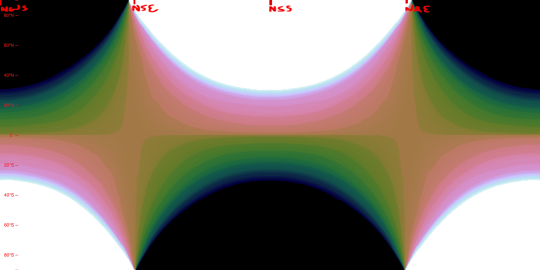
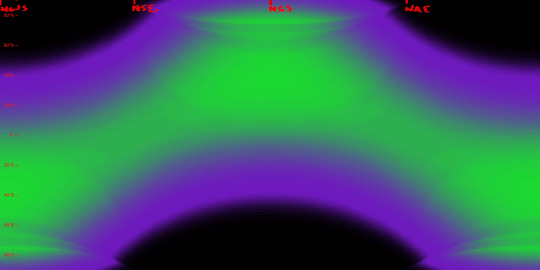
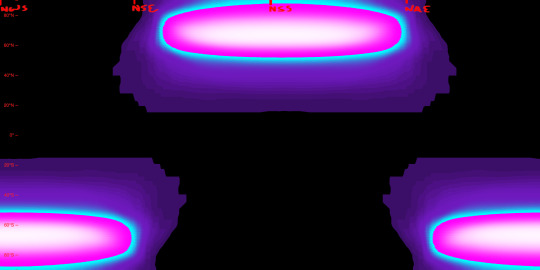
Next, there are the surface temperatures that occur on this planet, the key to which is shown above. The four maps below show the seasonal temperatures for land and sea, in order of Northern Spring Equinox, Northern Summer Solstice, Northern Autumn Equinox, and Northern Winter Solstice.
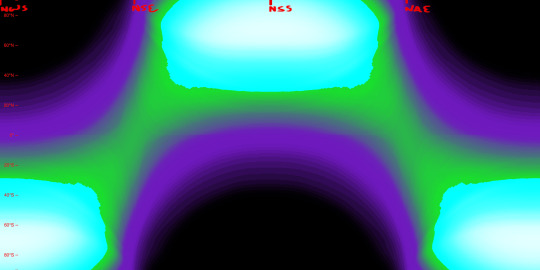
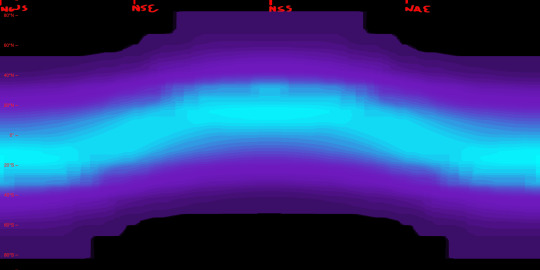
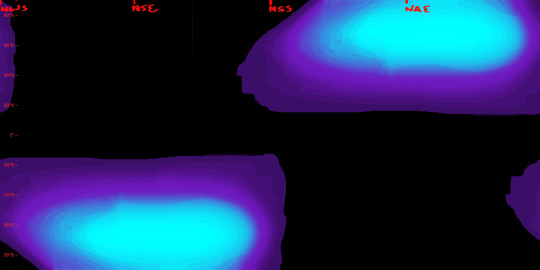
Correlating closely to the above data is the snow and ice cover, which is fairly extensive on this planet owing to its high obliquity and distance from its star. Land ice only occurs where the snow falls and is compacted year-round, but snow and sea ice can be much more seasonal.
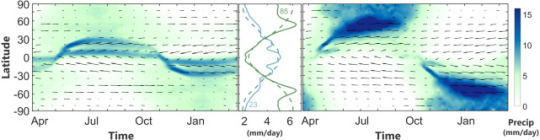
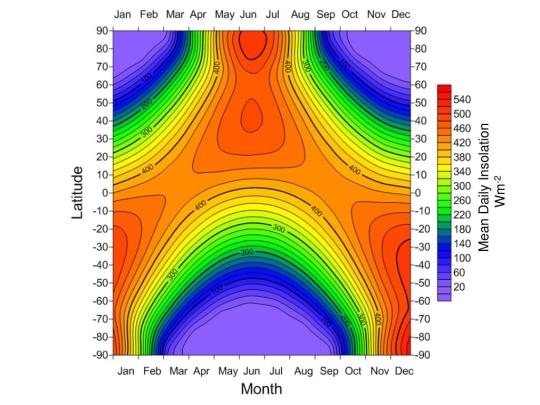
Seasonal precipitation levels were another important phase of this project, and the below diagram shows those levels for a given latitude (y-axis) on a given date (x-axis), with a key attached.
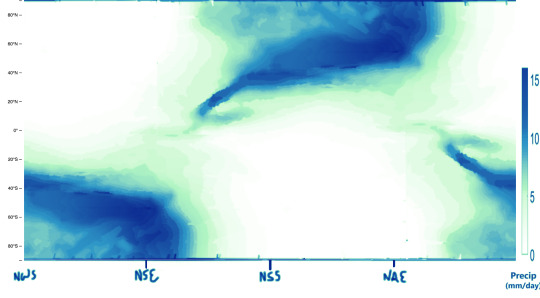
My reference for creating the above graphic is the figure below, which comes from a 2019 paper by A.H. Lobo and S. Bordoni titled “Atmospheric Dynamics of High Obliquity Planets”, and shows Earth’s precipitation levels compared to those of a planet with an 85° obliquity.
The following maps can now be better understood in light of these diagrams and keys.
-Northern Spring Equinox
-Northern Summer Solstice
-Northern Autumn Equinox

-Northern Winter Solstice
I was also tasked with mapping out the extent and density of this planet’s vegetation (or at least its alien equivalent), and from this you can see how wildly it varies by season, with very few year-round holdings. Precipitation is a major factor in where it is possible for plants to flourish, but snow cover and the extreme temperature swings limit it too. Near either pole, for example, within the space of a year temperatures soar far above Earth’s upper limits and also plummet below freezing; if either extreme were to be the annual norm for a region, some plants might adapt to those conditions, but because of the wild fluctuation any adaptations to one extreme would leave plants especially vulnerable to the other. These regions, then, remain barren regardless of rainfall or brief windows of mild temperatures, while areas with less wide temperature ranges allow for at least brief periods of flourishing.

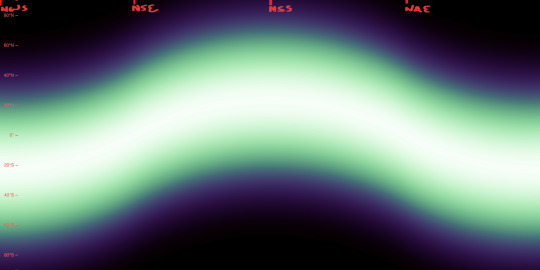
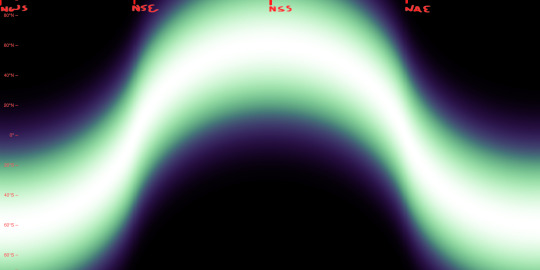
Determining the surface temperatures for this planet required a lot of background work. The first piece of the puzzle for this was knowing the number of daily hours of sunlight for a given latitude and date, which is exemplified first in this diagram for Earth:
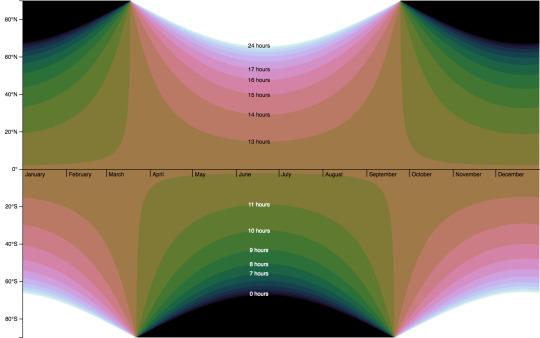
and then for the Birdbug planet, below. Since this planet rotates on an axis of 60 degrees, there are many more latitudes within range of either pole that experience periods of sunlight and darkness lasting longer than a day. The higher the latitude, the longer this period lasts, with the poles themselves experiencing either condition for half a year at a time.
Another important factor is the height to which the sun is seen to rise (more scientifically, the angle at which the sun’s light hits parts of the planet’s surface), seen here first for Earth and then for the Birdbug planet. In these diagrams, white represents the sun reaching the zenith of the sky (meeting the surface at a 90° angle), and black represents the sun failing to appear above the horizon (meeting at an angle of 0° or below), while shades of green and purple stand in for angles between those extremes. For Earth and the Birdbug planet alike, the sun reaches the zenith within the bounds of either planet’s Tropic circles of latitude, and fails to rise at all only within the Polar circles of latitude; the difference in obliquity means that the Birdbug planet’s key circles of latitude are flipped compared to Earth’s.
The duration of sunlight and the angle at which that sunlight is reaches the planet’s surface determine a planet’s Insolation, that is, the amount of solar energy it receives. The first image below is a preexisting diagram of Earth’s Insolation, where it is measured in watts per square meter. The next two images are my own attempts at replicating this data for Earth, and then for the Birdbug planet.
As seen in the diagrams above, Insolation on the Birdbug planet differs from Earth not only in its latitudinal distribution, but also in its sheer intensity at the higher latitudes. Compared to Earth there are twice as many latitudes for which the sun is shining longer than one rotational period, and many of those latitudes see the sun shine at a direct or nearly direct angle, whereas the Polar circles of latitude on Earth see the sun shine much more obliquely.
Below, we can see the data that all the above figures were instrumental in finding: that is, surface temperatures. The first image is a preexisting figure that measures Earth’s mean surface temperatures by date and latitude, and below that is my attempt at replicating the data by my own process.
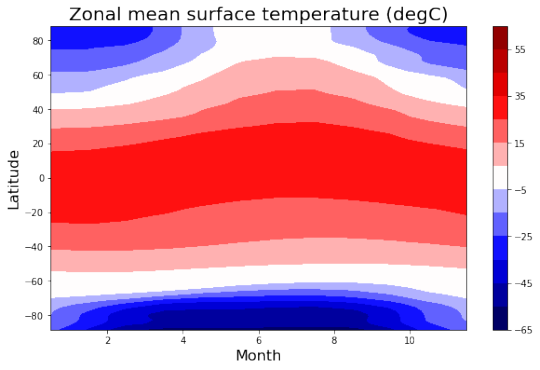
This is done not by just copying the seasonal Insolation data, but by also factoring in the yearly average for each latitude.
Above, we see the temperatures of the land by date and latitude, and below, we see the temperatures at the surface of the sea, which lag behind the land temperatures and remain comparatively mild.
Lastly, here’s an image I created to combine the snow and ice cover as well as the vegetation extent and density, as of the Northern Spring Equinox. This, along with the elevation map also seen here, is what I uploaded to maptoglobe.com in order to produce the screenshot at the top of this post.
These maps and figures (except for the preexisting ones) were all created in Photopea. Higher resolution versions of many of these images can be seen in my dedicated Reddit posts, linked below:
reddit post one, reddit post two
2022
#mapmaking#imaginary maps#worldbuilding#major project#imaginary planetology#elevation#waterways#river systems#surface temperatures#ice and snow cover#sea ice#precipitation#vegetation#Insolation#high obliquity planets#explanatory diagrams#digital rendering#Photopea#Birdbug worldbuilding project#Birgs#Birgworld#2022#digital painting#extremely long post#Christopher Maida Artwork
616 notes
·
View notes
Text

summary of my current draft in bad google draw format
#sam and max#splatoon#splatoon side order#it came to me like a divine vision but i dont think that was god#it's been really fun though lol#the bg of the SO lobby is a pic of what looks to be a gmod map of the lobby cuz i couldnt find any good angles of the place#and i dont own any splat games let alone the dlc#anyways i love the time traveling elevator it's so useful as a plot device#my art#i guess
10 notes
·
View notes
Text
Security Breach Question: In the Lost and Found room, the door requires a level 4 security pass and leads up to some stairs. Does anyone know where that goes or what that area is called exactly? I've combed through some playthroughs/walkthroughs on youtube but I haven't found anything yet
#i think they might just be utility tunnels but i'm also not sure#i wish i could find more specific maps that included images and also points of entry/exits to different levels aside from the elevators#naff nuh huh
30 notes
·
View notes
Text
a few new things I’m working on! I haven’t decided what I want to make more of or what I would sell yet, but new things are coming soon so keep an eye on my etsy!
#bookmark#etsy shop#etsy seller#bookmarks#handmade#zentangle#doodle#squiggle#elevation map#map art#eye#eye design#calculus#math#math doodle#etsy#placeholder bookmark
0 notes
Photo

Mean elevation of European countries
69 notes
·
View notes
Photo

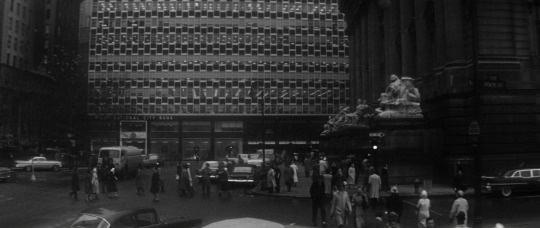
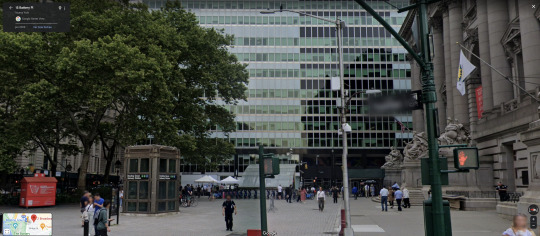

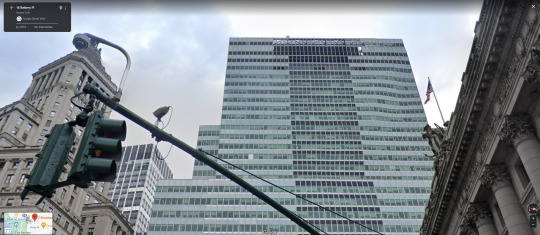
The Apartment
Billy Wilder. 1960
Office
2 Broadway, New York, NY 10004, USA
See in map
See in imdb
Bonus: also in this location
#billy wilder#the apartment#jack lemmon#shirley maclaine#fred macmurray#manhattan#skyscraper#bowling green#new york#movie#cinema#elevator#film#location#google maps#street view#1960
61 notes
·
View notes
Last Seen Blogs

dustbrush
Dust Brush
the-cosmic-slop
The Cosmic Slop

corvidcall
four crows in a trenchcoat

bandboysandmayhem
www.kitchendiningroomfurniture.net

amputi
Unbetitelt