#Earth observation
Text
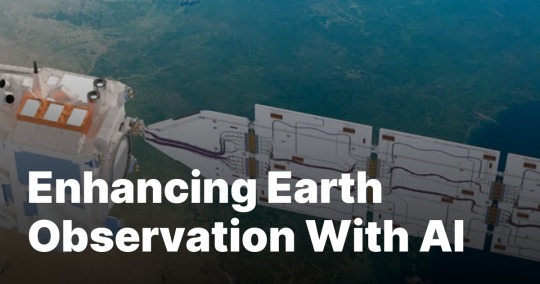
Enhancing Earth Observation With AI
Thanks to an international team led by Swinburne University of Technology and leading provider of global Earth observation data, Planet Labs, the AI-powered method reduces the cost of Earth Observation satellites while keeping the quality of images high.
Thanks to an international team led by Swinburne University of Technology and leading provider of global Earth observation data, Planet Labs, the AI-powered method reduces the cost of Earth Observation satellites while keeping the quality of images high.
Traditionally, designing and operating Earth observation satellites involves trade-offs between the size, cost and quality of different…
View On WordPress
0 notes
Link
The first NASA satellite to measure air pollution hourly shows so much promise that the space agen...
1 note
·
View note
Text
Lufuno Vhengani’s rare skills needed for SA’s official coastal #waterquality tool
Lufuno Vhengani has joined the Earth Observation for Water Quality (EO4WQ) team to help build South Africa’s official tracking tool for coastal and estuary waters.

Vhengani is a space scientist in the broadest sense, since he works with data from space satellites, but he is really the critical bridge between earth scientists and the data they use to make sense of the world.
After graduating with a B.Sc degree in mathematics, physics and mathematical statistics in the early 2000s, the Soweto-born technician ventured into electronics engineering. During a training session as part of a post-grad diploma at Stellenbosch University, he was among those who raised their hands to change their career trajectories to ‘remote sensing’.
Remote sensing broadly refers to detecting (sensing) information about the earth from a distance (remote), such as images or measurements taken by satellites orbiting the earth.
In 2007, a few years after completing a specialist diploma in France, Vhengani joined the Council for Scientific and Industrial Research (CSIR), where he is still a sought-after asset as an earth observation technologist today.
Many also think of him as a developer because he’s a self-taught Python programmer, but he’s quick to correct the misconception. “What I really am is a remote sensing specialist who tries to automate things using the Python programming language,” he says.
He made a name for himself in the earth observation community while working on a project to map areas burnt by wildfire using satellite data. His work eventually fed into the Advanced Fire Information System (AFIS) tool, which is very useful in a region like South Africa where wildfires have a big impact on trees and grasslands, and can cause major harm to infrastructure, homes, people and animals.
Vhengani says that as with wildfires and burnt areas, remote sensing can provide scientists with a wealth of information about water quality. For example, they can use satellite data to pinpoint the location of coastal oil spills or invasive plants, and they can monitor sea surface temperatures and harmful algal blooms.
“Unfortunately, satellite images require some expertise in order to process and interpret,” says Vhengani. “The work that we do provides users with information products that can be used to make decisions. This means our users don't have to go into the process of downloading and processing the data.”
“The EO4WQ tool makes it free and easy for anyone to monitor historical or near real-time changes in water quality, using detailed imagery from the world’s best Earth observation satellites," says the project lead Dr Marié Smith.
Like Vhengani, she is also an Earth observation expert at the CSIR, but with an oceanography background. She’s been working with her EO4WQ team to validate satellite data so that Vhengani can automate the way the data is downloaded, interpreted and visualised on the EO4WQ online interface.
“EO4WQ will be able to give users daily updates in lower spatial resolutions for near-real time tracking, using data from the Copernicus Sentinel-3 satellite. But it will also provide incredibly detailed (but less frequent) images taken by the Copernicus Sentinel-2’s sensors to better understand historical changes in smaller water bodies like estuaries,” says Smith.
Smith’s team has identified the algorithms that work best to produce accurate and useful data that non-experts can trust. Now Vhengani is working on automating these algorithms.
He says that while there are challenges on the user interface side of things, the back-end of the EO4WQ tool is working well.
The team hopes that by December 2023, high resolution data on suspended sediments and chlorophyll levels will be available for anyone to access.
“Success will mean we have worked on something different and new, and something that people can find useful,” says Vhengani.
The EO4WQ prototype is currently hosted on the Cyanolakes website, where it will live until it is ready to become the official Water Quality Decision Support Tool for ocean governance, as part of South Africa’s National Oceans and Coastal Information Management System (OCIMS).
EO4WQ is a collaboration between the CSIR, Cyanolakes and OCIMS, and is funded by the South African National Space Agency (SANSA) through their NRF/NEOFronteirs programme.
#water quality#earth observation#csir#SANSA#python#NRF#Cyanolakes#OCIMS#EO4WQ#Dr Marié Smith#Copernicus#sentinel#satellite
0 notes
Text
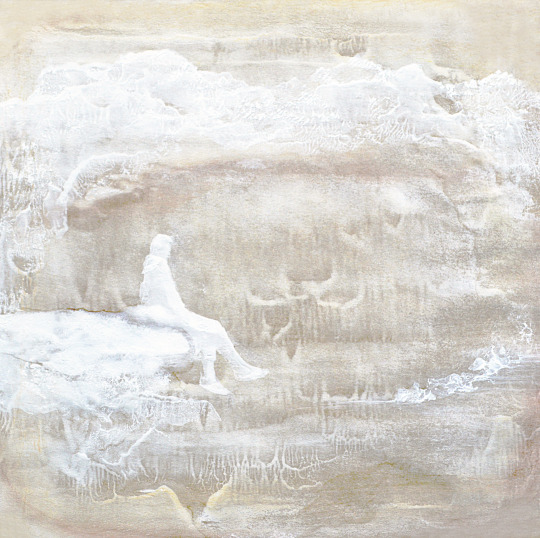
my work
observer
#art#mountains#snowy#earth observation#contemplation#white#light#meditative#ambient#zen art#landscapes#艺术#山
0 notes
Text
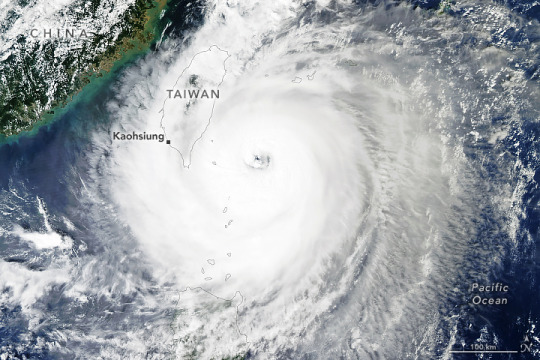
Taiwan Braces for Typhoon Koinu
After skirting north of the Philippines, Typhoon Koinu approached the southeastern coast of Taiwan on October 4, 2023. The storm was forecast to make landfall on the island the following morning.
The MODIS (Moderate Resolution Imaging Spectroradiometer) sensor on NASA’s Aqua satellite acquired this image of Koinu at approximately 1 p.m. local time on October 4. Its eye was about 200 kilometers (125 miles) off the coast of Taiwan and moving westward over the sea at 13 kilometers (8 miles) per hour, according to the Joint Typhoon Warning Center. Sustained wind speeds reached an estimated 210 kilometers (130 miles) per hour, nudging it into territory equivalent to a category 4 hurricane.
Taiwanese authorities issued weather alerts in anticipation of strong winds and heavy rain lashing the southeastern part of the island. Flights were canceled, schools and businesses were closed, and fishermen secured their boats, according to news reports. While the heaviest rain is expected to fall on mountainous and sparsely populated regions, the storm will also impact the major port city of Kaohsiung.
As Koinu passes over land, mountainous terrain should cause it to weaken; the exact path of the storm will dictate how much the topography influences its intensity. From there, forecasts show it continuing to lose strength as it approaches then skirts the coast of China.
While the storm was still offshore, subsiding air on its outer edges contributed to extreme heat in South China. On October 4, Hong Kong registered its hottest day on record for the month of October. Temperatures reached 34.6 degrees Celsius (94.3 Fahrenheit), the Hong Kong Observatory reported.
Several typhoons have affected this region in 2023, including Mawar in May, Doksuri in July, and Saola and Haikui in September. The Western Pacific typhoon season can span the entire year, though most storms develop between May and October.
NASA Earth Observatory image by Michala Garrison, using MODIS data from NASA EOSDIS LANCE and GIBS/Worldview. Story by Lindsey Doermann.
0 notes
Text
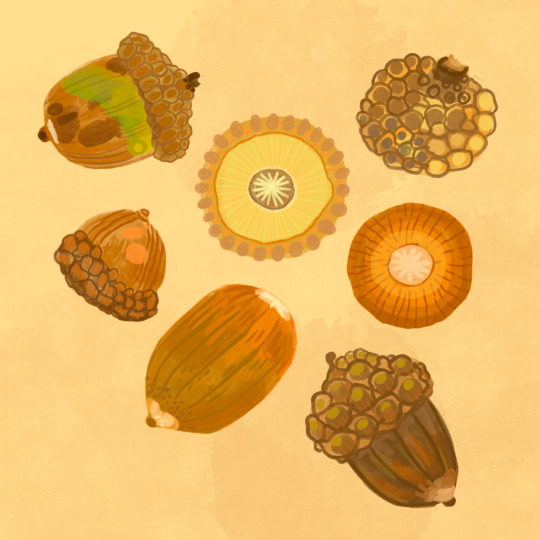
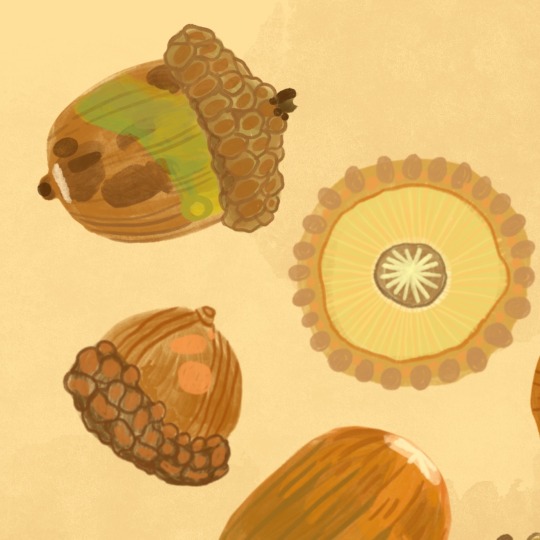
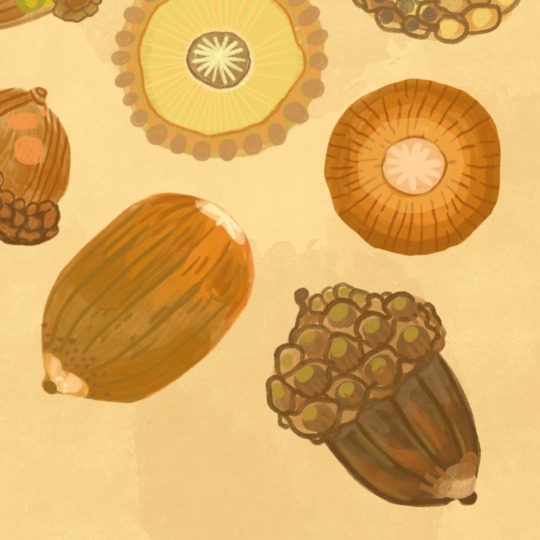
lil acorn study from the acorns I keep stuffing in my pockets :p
#art#artists on tumblr#peachmoss#digital art#original art#illustration#nature#acorns#earth observation#observant
1 note
·
View note
Video
Wildfires in Sicily da European Space Agency
Tramite Flickr:
Wildfires around the city of Palermo in Sicily, Italy, captured by the Landsat-8 mission on 25 July 2023. Data from the mission's SWIR bands, which penetrate the smoke of the fire, has been overlaid on the optical image to provide a clearer view of the fire front and affected area at the time of the acquisition. Credits: USGS/ESA
#ESA#European Space Agency#Space#Space Technology#Earth from Space#Observing the Earth#Earth Observation#Earth Explorer#Satellite image#Wildfires#Sicily#Sicilia#Italy#Italia#Palermo#Fire#Landsat-8#flickr
0 notes
Text
Grass-Stone-Metal-Human-Textile
1 note
·
View note
Text
Conversation IV - Breaking Boundaries, Space Community; I.D.E.A.S. for Sustainable Development.
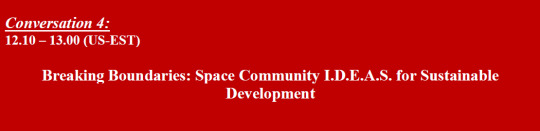
Space Science and Technology are becoming increasingly important for attaining the SDGs. Earth observation, weather forecasting, television and communication systems as well as wider scientific field such as Astronomy and Earth Sciences, all rely on GIST, satellite positioning, remote sensing and other technological advances Space science, technology and applications can support a range of pro-developmental activities, inter alia, sustainable cities and agricultural planning, biodiversity protection, tele-medicine and disaster risk management.
This conversation will highlight how countries can leverage space science and technologies to achieve the SDGs, specially SDG6 and its nexus, through concrete examples. It will also feature women in space experts with an aim to attract more women and girls to space sciences.
#Space Science#panel discussion#11 february#international Day of Women and Girls in Science#SDG 6#Space technologies#Earth observation#weather forecasting#television and communication systems#Astronomy#Earth Science#remote sensing#Sustainable Development#satellite positioning
0 notes
Text
astrology observation🐀
🦦sag 11h people can be the one who’s constantly making friends wherever they go and tend to be the “loud” one of the group
✨leo with cancer placements can be very difficult to understand or even get too know sometimes
🎀taurus placements especially 6h could be the type to only have a makeup/skincare routine and call it the day
⭐️pisces moons are the REAL empaths out of the other two water signs they constantly visions or use their imagination as if they were in someone else’s shoes
🌫️any virgo/pisces placement even asteroid or nn/sn are always people who help or want to be needed by someone or something , they will give you unwanted information and tips out of love and support
🍋leo 11h people are the definition of loyalty especially towards friends they do anything and every for/with them and will love you with ALL their heart
🌊cancer suns are really shy , quiet while cancer moons are talkative and love knowing people on a personal level
🫧virgos excessively lie idk if it’s the anxiety or they can’t handle accountability or what
🧌Capricorn 4H could mean you had to be mentally and emotionally independent or keep yourself busy, company from a very young age
☕️moon-saturn can mean having a very strained relationship with your mom or she didn’t really allow you to do anything as a child and now you are hesitant of getting out there and having fun
🦪many 9h placements are into foreign languages and traveling more than sagittarius natives
💫cancer risings with their leo 2nd house spend their money on frivolous things like clothes/makeup/art supplies and anything that they can express themselves with and cute their boredom
❄️speaking of cancer placements I think some cancer people with 3rd house cancer could love yearbooks , academic trophies or anything that reminds them of their accomplishments in school
🌹you can spot scorpio/aries placements a mile away the prominent brows , sharp features and the hard facial expressions
🪴libra 10H people attract a lot of people infatuated or insanely attracted to them finding them sexy/sex appeal??
🐚pisces + gemini in big 3 makes someone very creative and fun but also emotionally in-tune with their emotions plus extremely talkative
ANY AND I MEAN ANY LIBRA PLACEMENT IS SO FUCKING PRETTYYY🪷
🪰gemini venus can have like multiple standards/expectations for the people they wanna date
🐸aquarius suns are very adventurous and not afraid to take risks with gemini and libra think things through and can’t decide if they want to do it or not
🪩3rd house/9th house venus and moons listens too a variety of music genres they can go from hip-pop to country music
🌆Sagittarius risings or prominent jupiter influence in first house people have big cheeks ifykyk and very noticeable, contagious smiles
🎢air 3rd house people can go through or have many cars throughout their lives like they have a new car everytime you see them
🎠people with heavy mercury influence are very funny they are quick with it
🧌gemini mercury people are very good at mocking or mimicking how people sound or sing especially if has aspects or a Venusian degree (2°,14°,7°,19°)
👽Uranus 1H people can have very big/muscular calves even ankles
🧸something about aries moons and gemini suns just give off chaotic energy
1K notes
·
View notes
Text
The 8th house sign is not talked enough in astrology, the 8th house beside other things represents your intimacy, the 8th house is a powerful house, is a very sensible point in your chart.

Earth and Water Signs in the 8H can take this "intimacy" to another level since they can deeply connect with themselves
While Fire and Air signs in the 8H show much more excitement to discover their intimacy and their desires
#8th house#8th house placements#astrology#astro observations#birth chart#astro notes#astrology observations#placements#astro community#horoscope#ascendant#venus#fire#air#water#earth
639 notes
·
View notes
Text
Happy Earth Day!
805 notes
·
View notes
Text
🖇Astro Observations #1🖇

❗️All the observations in this post are based on personal experience and research, it's completely fine if it doesn't resonate with everyone❗️
✨️Paid Services ✨️ (Natal charts and tarot readings)Open.
🖇If you like my work you can support me through Ko-fi. Thank you!🖇
🖇Masterlist🖇

•Sun in 6th house tends to have obsessive tendencies with their daily routine, their scheduale is sacred for them, it gives them a sense of security.
•Aries moons have a "love/hate" relationship with their mothers, they can easily be in eachothers throat.
•Taurus-Aries duos are really underrated , I have seen these two being partners in a crime, a really beautiful friendship.
•Scorpio and Leo risings are very misjudged, people project a lot in them.
•I realized that Mercury in Sagittarius/Libra or Mercury in the 9th house LOVES gossip, even the silly ones.
•Venus in Virgo people take their time to like someone, but when they do they will romanticize the person a lot.
•Earth placements have beautiful hands and nails, really princess vibes.
•Mars 3rd house has quick and clever comebacks in discussions, words are their weapon.
•Gemini Mars or Mars in the 3rd house tend to use other people's secrets during fights/arguments.
•Leos Midheaven wants to try 1000 different career paths, they're like Barbie. This individuals tend to be good in many things.

#astrology#astrology moodboard#astrology placements#astro observations#astro blog#birth chart#astro notes#astrology observations#astro placements#placements#astro community#horoscope#zodiac#zodiac observations#astro com#astro seek#virgo#taurus#leo#scorpio#cancer#earth placements#water placements#air placements#fire placements#gemini#aries#sagittarius
934 notes
·
View notes
Text
Oceanographers go “old school” to check new tech
Believe it or not, but #oceancolour data from satellites are sometimes still validated ‘on the ground’ in the same way it was done nearly 200 years ago - by lowering a Secchi disk down into the water.
“A Secchi disk is basically a white, 30 centimeter, weighted plate that you lower down the water column until you can't see it anymore,” says Dr Marié Smith, an expert in marine earth observation at the CSIR.
“The depth at which the disk disappears is the measurement we use for water clarity, or water turbidity.”
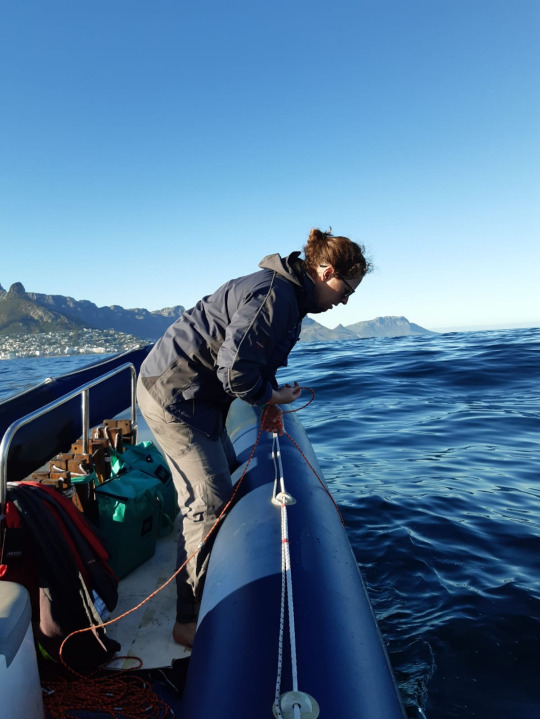
Dr Marié Smith (CSIR) out in Table bay doing Secchi disk measurements off the side of a rubber duck motorboat in March 2023. Her team is validating satellite data for EO4WQ by using physical ocean measurements. EO4WQ will become the official Water Quality Decision Support Tool for ocean governance, as part of South Africa’s National Oceans and Coastal Information Management System (OCIMS).
The device is used to measure water transparency in lakes, oceans and fish farms, and was invented by Angelo Secchi in 1865. He was a catholic priest who dabbled in oceanography, meteorology, physics and astronomy.
Smith is also an oceanographer by training, but she uses Secchi disk measurements to calibrate the algorithms that turn vast satellite datasets into simple, easy-to-use snapshots of ocean water quality.
“We need to test if the algorithms we are using actually represent what is happening in South Africa’s waters.
“So, we went ‘old school’- we pick a date and time to go out on a boat to take water measurements when we know it's going to be cloud-free, and when the satellite is going to be flying over directly above us at the same time,” says Smith.
Her team is validating satellite data for the EO4WQ project (Earth Observation for Water Quality), and using these to develop free, online tools for monitoring coastal water quality. EO4WQ will eventually become the official Water Quality Decision Support Tool for ocean governance, as part of South Africa’s National Oceans and Coastal Information Management System (OCIMS).
Smith says her team is busy with the groundwork to get to a point where non-expert users can trust that the near-real time images and information they get from the EO4WQ tool are accurate and useful.
“Once we know which algorithm works best, we can apply it to all of the historical satellite data as well. Many people involved in land-sea operations and coastal fisheries have indicated that they want to use this data, so we are making it available through EO4WQ in an accessible format for the first time.”
By December 2023, Smith hopes to have high resolution data on suspended sediments and chlorophyll levels available for anyone to access.
“EO4WQ will be able to give users daily updates in lower spatial resolutions for near-real time tracking, using data from the Copernicus Sentinel-3 satellite. But it will also provide incredibly detailed (but less frequent) images taken by the Copernicus Sentinel-2’s sensors to better understand historical changes in smaller water bodies like estuaries,” says Smith.
The EO4WQ prototype is currently hosted on the Cyanolakes website, which originally pioneered free satellite data on inland water bodies to the South African public.
Smith believes the public, including scientists, fishery operators, abalone farmers, journalists, municipal water managers, environmental managers, conservationists and others involved in the day-to-day coastal or estuary operations will benefit most from using this tool.
The EO4WQ project is a collaboration between the CSIR, Cyanolakes and OCIMS, and is funded by the South African National Space Agency (SANSA) through their NRF/NEOFronteirs programme.
1 note
·
View note
Text
Some beautiful work!
#astronomy#nasa#astronomers#universe#astrophotography#nasa photos#astrophysics#outer space#nasawebb#hubble space telescope#i love astronomy#astronomy facts#astrography#astrobiology#astronauts#astro observations#space travel#international space station#space science#spacecraft#space exploration#space#science facts#planetary science#planetary nebula#planet earth#nasaastronaut#nasa picture of the day#cosmos#the universe
804 notes
·
View notes
Text


Melting on Humboldt Glacier
Every year from around May to early September, melting takes place atop the vast sheet of ice covering Greenland. Toward the end of August 2023, unseasonably warm weather led to several days of widespread melting. The unusual late-season event peaked island-wide on August 22, when melting spanned nearly 730,000 square kilometers (282,000 square miles), or about 45 percent of the ice sheet’s surface, according to the National Snow and Ice Data Center.
This pair of images shows the front of Humboldt Glacier in northwest Greenland before and after melting peaked. The images were acquired on August 18 (left) and August 27 (right) by the Operational Land Imager (OLI) on Landsat 8.
Notice that by August 27, recent snow and the underlying compressed snow, or firn, (white) has retreated, exposing more dirt-stained ice (gray and brown). The darkest blue areas farther inland are saturated firn, melt ponds, and possibly some ephemeral streams. Areas in between could be slushy wet firn mixed with areas where water has drained away or refrozen. Besides contributing directly to sea level rise, meltwater can flow to the base of the ice sheet via crevasses and moulins, accelerating the flow of ice toward the ocean.
Christopher Shuman, a University of Maryland, Baltimore County, glaciologist based at NASA’s Goddard Space Flight Center, identified and analyzed the two satellite images. Overall, “the area is a mishmash of ice, firn, melt, and dirt,” he said.
June and July saw steady, higher-than-average melting that kept the season on par with several other high melt seasons in recent decades. But the spike in late August pushed the cumulative melt area even higher, and the month ended with the second-largest cumulative melt area in the 45-year satellite record, trailing only 2012.
There have been other late-season melt events, notably in September 2010. That event pushed the season toward a larger amount of cumulative melting compared to the 2023 season so far (as of the start of September).
Late-season melting adds to the cumulative losses within a season, but it can also affect future melt seasons. A longer melt season delays the accumulation of surface snow, which in turn can affect the intensity of melting at the start of the next season.
NASA Earth Observatory images by Wanmei Liang, using Landsat data from the U.S. Geological Survey. Story by Kathryn Hansen.
1 note
·
View note
Last Seen Blogs
elton-john-live-concerts
Elton John Photo Concerts

belgravia250-blog
Belgravia Gallery

yannij29
Living and Partly Living

gamuzaheld-blog
ANTELOPE KNIGHT.

jouronlex
Jouron Lex YouTube