#Clustering
Text
Can a 6 cM connection be meaningful?
When it comes to small DNA segments, we’ve heard the “glass half empty” version of the story many times. Here’s the other side of that story.
Submitted for your consideration: A pair of third cousins twice removed and their 6 cM connection…
According to AncestryDNA, Bryan Smith and his cousin, K, share 6 cM of DNA across 1 segment. And according to Ancestry’s ThruLines, Bryan and Cousin K share a pair of third great grandparents, Reuben Willis Smith and his wife Mary Connell.

The cM value is certainly consistent with the identified relationship but did Bryan and Cousin K inherit their shared DNA from the Smith ancestry as shown? Is the 6 cM segment even valid or could it be an artifact of an imperfect DNA matching algorithm?
Let’s start with an easy evaluation: the shared match list.
Among Bryan and K’s list of shared matches at AncestryDNA:
HG, a descendant of Reuben and Mary’s son, Charles Thomas Smith (HG shares 57 cM with Bryan)
RR, a descendant of Reuben and Mary’s daughter, Fannie Janes Smith (RR shares 47 cM with Bryan and 38 cM with K)
IG, another descendant of Reuben and Mary’s son, Charles Thomas Smith (IG shares 47 cM with Bryan and 71 cM with K)
And at least three other descendants of Reuben and Mary are on the shared match list.
So we’re off to a promising start. In addition to the fact that Bryan and K share DNA and a paper trail leading to Ruben and Mary, this group of matches gives us more evidence suggesting that Bryan and K might be related as suspected.
But what about that 6 cM segment shared by Bryan and K? Is it valid? Did it come from the shared Smith ancestors or did it originate elsewhere?
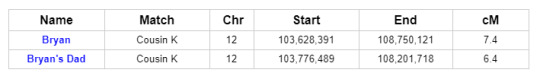
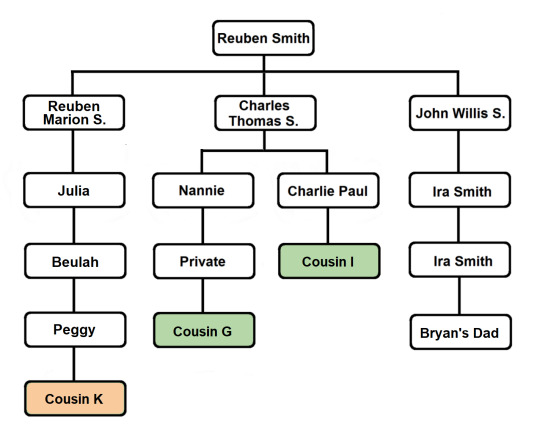
To get the most comprehensive help in answering these questions, we turn to GEDmatch. As indicated in the ThruLine image above, both Bryan and his father are related to DNA Cousin K through their Smith line. And because K is on GEDmatch, we can see that Bryan and his father both share DNA with K on a specific portion of Chromosome 12:
Further investigation reveals that two other descendants of Reuben and Mary, Cousins I and G, share DNA with Bryan and his father on Chromosome 12 in roughly the same location. In fact, all of the matches in question match each other on Chromosome 12:
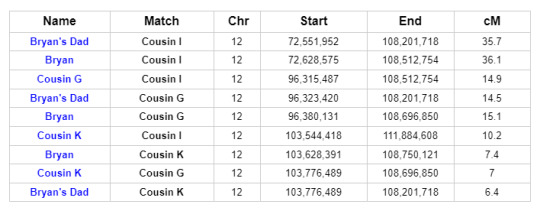
This is what we call a Triangulation Group. It brings the possible genetic connections into sharper focus.
The common segment shared by all of the members of this Triangulation Group indicates that they all share a common ancestor. And we’ve already identified shared ancestry through the Smith line. Cousins I and G are first cousins once removed and they are descendants of Reuben and Mary’s son Charles Thomas Smith...
A review of the pedigrees of the matches in question reveals no lines of shared ancestry other than the known shared Smith line. This investigation is summarized briefly in the table below, listing 2nd great grandparent surnames and shared ancestors (blue for paternal names and surnames, light red for maternal names and surnames):
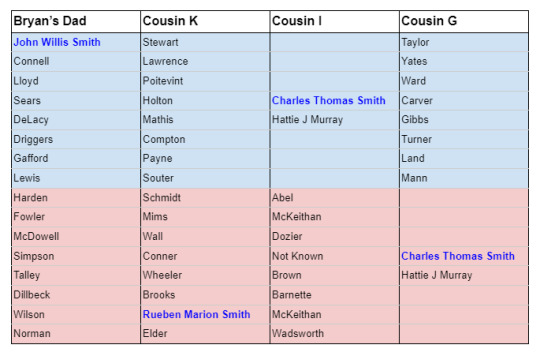
Although we cannot say with perfect certainty that there is no additional common ancestry that conceivably could account for the shared segment of DNA on Chromosome 12, the known evidence doesn’t leave room for much doubt.
For completeness, here’s a chart summarizing the amount of DNA shared by the relatives in question:

And cluster analysis for Cousin G yields a cluster with eight descendants of Reuben Willis Smith, including Bryan Smith and Cousin K:

Not everyone will feel the need to go this far to investigate a 6 cM connection. But this post provides examples of ways to investigate the validity of an ordinary small segment and to determine whether the shared DNA legitimately belongs with the presumed paper trail source of the DNA.
Discussion
Skepticism regarding small segments of shared DNA is appropriate. In comparison to larger shared segments, such segments are more likely to be IBS (false). Additionally, even when small segments can be shown to be reliable, we have to grapple with the fact that small segments can be too old to fall within the reach of reliable historical documentation.
With the exponential growth of the DNA matching databases, the impetus to explore distant matches waned. Reluctance to do the strenuous work involved in using small segments grew. With access to strong genetic connections leading back to target ancestors, why bother with low cM connections?
The sentiment is understandable!
On the other hand, I believe that excessive skepticism has impeded progress in genetic genealogy. As databases have grown, our opportunities for research have multiplied and our research techniques have improved. But at the same time, goalposts for small segment success have been moved to poorly-defined and very unreasonable points.
[From the skeptics: Your success with a small segment doesn’t count if you find a larger segment in a relative! I don’t want to hear about triangulation! Visual phasing is not allowed!]
If we applied such arbitrary restrictions to all areas of genealogy, we’d struggle to get our work done!
Even with our luxuriously large DNA databases, distant genetic connections are the only connections available in some areas of investigation (or to people who hail from less heavily-tested populations). Defeatist refusal to accept low cM matches as evidence in genetic genealogy needlessly limits our potential.
Don’t get me wrong, I’m fully in favor of scholarly rigor. But let’s not allow skepticism to pave the way for denialism!
When distant genetic connections are found to be of dubious quality, they should be set aside. But shared segments should not be judged on the basis of size alone. Even the most fervent opponents of small-segment research will admit that small segments are often valid (IBD). And while these opponents frequently cite IBD/IBS percentages, they ironically fail to see that our ability to find these percentages points directly to a practical method for sorting distant matches on an individual basis.
We are privileged to have access to enormous databases of incredibly valuable genetic information. More than a statistical hiccup that can lead us serendipitously to more reliable information, small DNA segments are messages we carry with us every day, testifying to our connections with our ancestors. Genetic information, even in small amounts, can be just as valuable as any other form of information. We should be good stewards of that information and we should invest good faith effort in understanding how our distant matches can inform us about our rich ancestral history.
I’ll close with this analogy for small segments:
You want some refreshing water but the glass is only half-full. Drink it or toss it out?

Posted with Bryan Smith’s permission. 17 May 2023
#genetic genealogy#DNA testing#DNA#small segments#visual phasing#Triangulation#dna segment#DNA segment triangulation#DNA clustering#clustering#pedigree#family tree#ThruLines
3 notes
·
View notes
Text
As a late diagnosed autist I will say one of the most damaging but transformative experiences I've ever had was being misdiagnosed with BPD.
Everyday my heart goes out to people with BPD.
The amount of stigma and silencing they face is astonishing and sickening.
I took DBT for years. Therapists use to turn me away because of my diagnosis.
I would be having full blown autistic meltdowns, crying for help literally - but because I was labeled as BPD ANY time I cried I was treated as manipulative and unstable.
As if the only reason I could be crying was if I was out to trick someone.
95% of the books out there with Borderline in the title are named shit like 'How to get away from a person with Borderline', 'How to stop walking on eggshells (with a person who has BPD)'
I was never allowed to feel true pain or panic or need.
That was 'attention seeking behavior', not me asking for help when a disability was literally inhibiting my ability to process emotions.
There were dozens of times where I had a full meltdown and was either threatened with institutionalization or told I was doing it for attention.
My failing relationships weren't due to a communication issue, or the inability to read social cues. No, because I was labeled borderline, my unstable relationships were my fault. Me beggong nuerotypicals to just be honest and blunt with what they meant was me pestering them for validation.
Borderline patients can't win.
And the funny thing is - I asked my therapist about autism. I told her I thought I was on the spectrum.
BPD is WILDLY misdiagnosed with those with autism and I had many clear signs.
Instead - she told me 'If you were autistic we wouldn't be able to have this conversation'. She made me go through a list of autistic traits made clearly for children, citing how I didn't fit each one.
And then she told me that me identifying with the autism community was the BPD making me search for identity to be accepted - and that I wasn't autistic, just desperate to fit in somewhere.
I didn't get diagnosed for another ten years. For ten years I avoided the autism community - feeling as if I were just a broken person who wanted to steal from people who 'really needed it'.
Because of my providers - I began to doubt my identity MORE, not less.
Ten years of thinking I was borderline and being emotionally neglected and demonized by a system meant to help me.
To this day, I still don't trust neurotypicals. Not fully.
I know I'm not borderline now - but my heart aches for them. Not for the usual stuff. But for the stigma. And the asshole doctors. And the dismissiveness and threatening and the idea of institutionalization hanging over their head.
I love Borderline people. I always will. I'm not Borderline but if you are I love you and I'm sorry.
You're not a bad person. You're not a therapists worst nightmare, you are a human with valid feelings and fears.
Borderline people I'm sorry.
#autism#bpd#borderline personality disorder#actually autistic#neurodivergent#neurodivergency#neurodiversity#cluster b
36K notes
·
View notes
Text
Optimizing Performance on Enterprise Linux Systems: Tips and Tricks
Introduction: In the dynamic world of enterprise computing, the performance of Linux systems plays a crucial role in ensuring efficiency, scalability, and reliability. Whether you're managing a data center, cloud infrastructure, or edge computing environment, optimizing performance is a continuous pursuit. In this article, we'll delve into various tips and tricks to enhance the performance of enterprise Linux systems, covering everything from kernel tuning to application-level optimizations.
Kernel Tuning:
Adjusting kernel parameters: Fine-tuning parameters such as TCP/IP stack settings, file system parameters, and memory management can significantly impact performance. Tools like sysctl provide a convenient interface to modify these parameters.
Utilizing kernel patches: Keeping abreast of the latest kernel patches and updates can address performance bottlenecks and security vulnerabilities. Techniques like kernel live patching ensure minimal downtime during patch application.
File System Optimization:
Choosing the right file system: Depending on the workload characteristics, selecting an appropriate file system like ext4, XFS, or Btrfs can optimize I/O performance, scalability, and data integrity.
File system tuning: Tweaking parameters such as block size, journaling options, and inode settings can improve file system performance for specific use cases.
Disk and Storage Optimization:
Utilizing solid-state drives (SSDs): SSDs offer significantly faster read/write speeds compared to traditional HDDs, making them ideal for I/O-intensive workloads.
Implementing RAID configurations: RAID arrays improve data redundancy, fault tolerance, and disk I/O performance. Choosing the right RAID level based on performance and redundancy requirements is crucial.
Leveraging storage technologies: Technologies like LVM (Logical Volume Manager) and software-defined storage solutions provide flexibility and performance optimization capabilities.
Memory Management:
Optimizing memory allocation: Adjusting parameters related to memory allocation and usage, such as swappiness and transparent huge pages, can enhance system performance and resource utilization.
Monitoring memory usage: Utilizing tools like sar, vmstat, and top to monitor memory usage trends and identify memory-related bottlenecks.
CPU Optimization:
CPU affinity and scheduling: Assigning specific CPU cores to critical processes or applications can minimize contention and improve performance. Tools like taskset and numactl facilitate CPU affinity configuration.
Utilizing CPU governor profiles: Choosing the appropriate CPU governor profile based on workload characteristics can optimize CPU frequency scaling and power consumption.
Application-Level Optimization:
Performance profiling and benchmarking: Utilizing tools like perf, strace, and sysstat for performance profiling and benchmarking can identify performance bottlenecks and optimize application code.
Compiler optimizations: Leveraging compiler optimization flags and techniques to enhance code performance and efficiency.
Conclusion: Optimizing performance on enterprise Linux systems is a multifaceted endeavor that requires a combination of kernel tuning, file system optimization, storage configuration, memory management, CPU optimization, and application-level optimizations. By implementing the tips and tricks outlined in this article, organizations can maximize the performance, scalability, and reliability of their Linux infrastructure, ultimately delivering better user experiences and driving business success.
For further details click www.qcsdclabs.com

#redhatcourses#redhat#linux#redhatlinux#docker#dockerswarm#linuxsystem#information technology#enterpriselinx#automation#clustering#openshift#cloudcomputing#containerorchestration#microservices#aws
0 notes
Text
154
時系列データ内部にある様々な長さの部分列を似てるもの同士クラスタリングして表示するページ作った。
まだ適当なつくりだけど。。正常系だけ動く程度。無料なのでお気軽にお試しください。
使い方
・右上の SET DATA押す
・でかい入力欄にデータを入力する。1,3,5,2,4,6とか。
・データ入力が面倒なら、generate randomsの3つの入力欄に値入れて、SET RANDOMS押して乱数を設定もできる。
・SUBMIT押すと結果が表示される。
注意
・入力値や結果は保存されません。
・時系列データの長さは最大200くらいにしておかないと時間かかりすぎます。
・予告なしにシステムは変わります。
render.comっていうwebサービスを動かせるサイト使った。無料枠にしたので、しばらくアクセスがないと再アクセスに50秒くらいかかる。待っててね。
今後、解析に役立つパラメータ入力欄とか機能とか追加していきます。あとクラスタリングのアルゴリズムも改良する。長い部分列になると、これ似てないなと感覚的に思う結果も出てきてる。
0 notes
Text
youtube
Session 14 : Clustering in Machine Learning | The Importance of Clustering in Data Analysis
In Session 14, we delve into the fascinating world of Clustering in Machine Learning, uncovering the crucial role it plays in effective data analysis. Whether you're a beginner or looking to deepen your understanding, this session simplifies the complexities of clustering algorithms, making them accessible for everyone.
youtube
Follow #LearnAndGrowCommunity
#Clustering#MachineLearning#DataAnalysis#UnsupervisedLearning#PatternRecognition#DataPatterns#DecisionMaking#DataInsights#DataScience#TechEducation#AlgorithmExplained#AIInnovation#TechTalks#DataOrganization#DataMining#EducationalContent#TechSimplified#DataUnderstanding#AlgorithmsInAction#LearnTechNow#Youtube
1 note
·
View note
Text
2024 is the year of clustering! this year, every surface we own we are scattering books, jewellery, pens, skin care, perfumes, used makeup wipes, little toys, letters, lighters, gum, crystals, hair ties, makeup, notes, stickers, candles, things that bring is joy!
1 note
·
View note
Text
KMeans Clustering Assignment
Import the modules
from pandas import Series, DataFrame
import pandas as pd
import numpy as np
import matplotlib.pylab as plt
from sklearn.model_selection import train_test_split
from sklearn import preprocessing
from sklearn.cluster import KMeans
Load the dataset
data = pd.read_csv("C:\Users\guy3404\OneDrive - MDLZ\Documents\Cross Functional Learning\AI COP\Coursera\machine_learning_data_analysis\Datasets\tree_addhealth.csv")
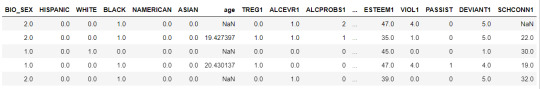
data.head()
upper-case all DataFrame column names
data.columns = map(str.upper, data.columns)
Data Management
data_clean = data.dropna()
data_clean.head()
subset clustering variables
cluster=data_clean[['ALCEVR1','MAREVER1','ALCPROBS1','DEVIANT1','VIOL1',
'DEP1','ESTEEM1','SCHCONN1','PARACTV', 'PARPRES','FAMCONCT']]
cluster.describe()

standardize clustering variables to have mean=0 and sd=1
clustervar=cluster.copy()
clustervar['ALCEVR1']=preprocessing.scale(clustervar['ALCEVR1'].astype('float64'))
clustervar['ALCPROBS1']=preprocessing.scale(clustervar['ALCPROBS1'].astype('float64'))
clustervar['MAREVER1']=preprocessing.scale(clustervar['MAREVER1'].astype('float64'))
clustervar['DEP1']=preprocessing.scale(clustervar['DEP1'].astype('float64'))
clustervar['ESTEEM1']=preprocessing.scale(clustervar['ESTEEM1'].astype('float64'))
clustervar['VIOL1']=preprocessing.scale(clustervar['VIOL1'].astype('float64'))
clustervar['DEVIANT1']=preprocessing.scale(clustervar['DEVIANT1'].astype('float64'))
clustervar['FAMCONCT']=preprocessing.scale(clustervar['FAMCONCT'].astype('float64'))
clustervar['SCHCONN1']=preprocessing.scale(clustervar['SCHCONN1'].astype('float64'))
clustervar['PARACTV']=preprocessing.scale(clustervar['PARACTV'].astype('float64'))
clustervar['PARPRES']=preprocessing.scale(clustervar['PARPRES'].astype('float64'))
split data into train and test sets
clus_train, clus_test = train_test_split(clustervar, test_size=.3, random_state=123)
k-means cluster analysis for 1-9 clusters
from scipy.spatial.distance import cdist
clusters=range(1,10)
meandist=[]
for k in clusters:
model=KMeans(n_clusters=k)
model.fit(clus_train)
clusassign=model.predict(clus_train)
meandist.append(sum(np.min(cdist(clus_train, model.cluster_centers_, 'euclidean'), axis=1))
/ clus_train.shape[0])
"""
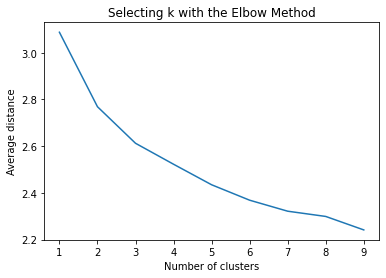
Plot average distance from observations from the cluster centroid
to use the Elbow Method to identify number of clusters to choose
"""
plt.plot(clusters, meandist)
plt.xlabel('Number of clusters')
plt.ylabel('Average distance')
plt.title('Selecting k with the Elbow Method')
Interpret 3 cluster solution
model3=KMeans(n_clusters=3)
model3.fit(clus_train)
clusassign=model3.predict(clus_train)
plot clusters
from sklearn.decomposition import PCA
pca_2 = PCA(2)
plot_columns = pca_2.fit_transform(clus_train)
plt.scatter(x=plot_columns[:,0], y=plot_columns[:,1], c=model3.labels_,)
plt.xlabel('Canonical variable 1')
plt.ylabel('Canonical variable 2')
plt.title('Scatterplot of Canonical Variables for 3 Clusters')
plt.show()
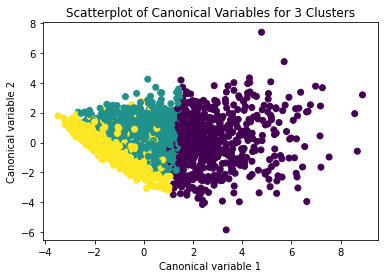
The datapoints of the 2 clusters in the left are less spread out but have more overlaps. The cluster to the right is more distinct but has more spread in the data points
"""
BEGIN multiple steps to merge cluster assignment with clustering variables to examine
cluster variable means by cluster
"""
create a unique identifier variable from the index for the
cluster training data to merge with the cluster assignment variable
clus_train.reset_index(level=0, inplace=True)
create a list that has the new index variable
cluslist=list(clus_train['index'])
create a list of cluster assignments
labels=list(model3.labels_)
combine index variable list with cluster assignment list into a dictionary
newlist=dict(zip(cluslist, labels))
newlist
convert newlist dictionary to a dataframe
newclus=DataFrame.from_dict(newlist, orient='index')
newclus
rename the cluster assignment column
newclus.columns = ['cluster']
now do the same for the cluster assignment variable
create a unique identifier variable from the index for the
cluster assignment dataframe
to merge with cluster training data
newclus.reset_index(level=0, inplace=True)
merge the cluster assignment dataframe with the cluster training variable dataframe
by the index variable
merged_train=pd.merge(clus_train, newclus, on='index')
merged_train.head(n=100)
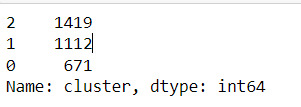
cluster frequencies
merged_train.cluster.value_counts()
"""
END multiple steps to merge cluster assignment with clustering variables to examine
cluster variable means by cluster
"""
FINALLY calculate clustering variable means by cluster
clustergrp = merged_train.groupby('cluster').mean()
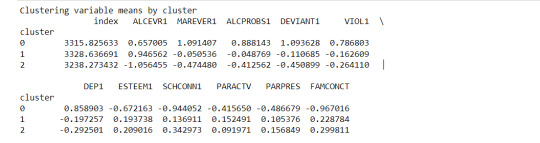
print ("Clustering variable means by cluster")
print(clustergrp)
validate clusters in training data by examining cluster differences in GPA using ANOVA
first have to merge GPA with clustering variables and cluster assignment data
gpa_data=data_clean['GPA1']
split GPA data into train and test sets
gpa_train, gpa_test = train_test_split(gpa_data, test_size=.3, random_state=123)
gpa_train1=pd.DataFrame(gpa_train)
gpa_train1.reset_index(level=0, inplace=True)
merged_train_all=pd.merge(gpa_train1, merged_train, on='index')
sub1 = merged_train_all[['GPA1', 'cluster']].dropna()
Print statistical summary by cluster
import statsmodels.formula.api as smf
import statsmodels.stats.multicomp as multi
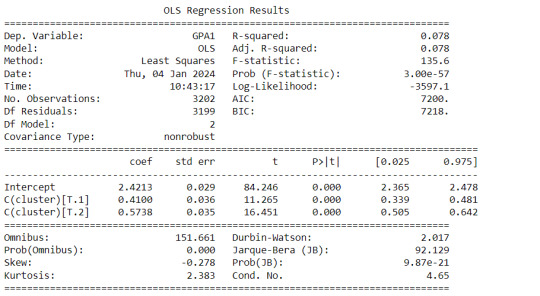
gpamod = smf.ols(formula='GPA1 ~ C(cluster)', data=sub1).fit()
print (gpamod.summary())
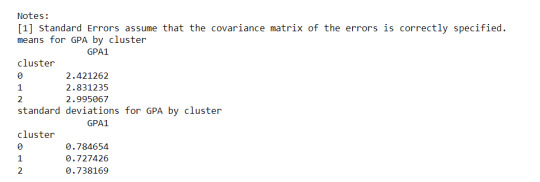
print ('means for GPA by cluster')
m1= sub1.groupby('cluster').mean()
print (m1)
print ('standard deviations for GPA by cluster')
m2= sub1.groupby('cluster').std()
print (m2)
Interpretation
The clustering average summary shows Cluster 0 has higher alcohol and marijuana problems, shows higher deviant and violent behavior, suffers from depression, has low self esteem,school connectedness, paraental and family connectedness. On the contrary, Cluster 2 shows the lowest alcohol and marijuana problems, lowest deviant & violent behavior,depression, and higher self esteem,school connectedness, paraental and family connectedness. Further, when validated against GPA score, we observe Cluster 0 shows the lowest average GPA and CLuster 2 has the highest average GPA which aligns with the summary statistics interpretation.
0 notes
Text
reblog to blow up an ableist
#npd safe#bpd safe#hpd safe#aspd safe#cluster b safe#cw explosion mention#cw violence mention#cw ableism mention#cw reblog bait#reblog bait
15K notes
·
View notes
Text

NASA Data Sonification: Black Hole Remix
In this sonification of Perseus. the sound waves astronomers previously identified were extracted and made audible for the first time. The sound waves were extracted outward from the center. (source)
#space#black holes#perseus#nasa#sound waves#solar winds#interesting#perseus galaxy cluster#sonification
123K notes
·
View notes
Text
"We need more mental health acceptance and awareness!" Y'all still call ppl with cluster b disorders evil 💀
"We need more weird people!" Y'all COMBUST when someone is xenic 💀
"Healthy coping mechanisms are important!" When someone age regresses, you call them creepy 😭
"More people need to be proud of who they are!" When you see a furry, you cry 😭
(U should totes follow me if ur a supporter of these so I can b on the good side of tumblr XD /nf!)
#mogai#xenogender#hpd#bpd#npd#aspd#cluster b#cluster b pd#pds#furry#fursona#queer#actually hpd#actually cluster b#agere#age regression#sfw agere#sfw#actually histrionic#sfw furry#xenic#xenogender user
8K notes
·
View notes
Text

uhh???
#npd#cluster b#npd safe#actually narcissistic#actually npd#npd culture is#npd traits#npd positivity#npd posting
5K notes
·
View notes
Text
my anhedonia is eating me alive so i’m making these mental illness memes to cope
#actually aspd#actually npd#aspd#npd#clusterb#actually mentally ill#actually bpd#actuallyaspd#actuallynpd#cluster b#bpd#actuallybpd#actually schizophrenic#actually delusional#actually borderline#actually obsessive#actually autistic#actually antisocial#actually narcissistic#schizophrenia#schizospec#psychotic spectrum#did#osdd#ocd#actually pocd#mental illness#cluster b personality disorder#cluster b memes#npd meme
5K notes
·
View notes
Text
People with psychotic disorders are neurodivergent too.
People with personality disorders are neurodivergent too.
People with substance abuse disorders are neurodivergent too.
People with tic disorders are neurodivergent too.
People with bipolar disorder are neurodivergent too.
People with dissociative disorders are neurodivergent too.
Neurodivergence isn’t just ADHD, autism, anxiety, and depression. (Plus those last two also get left out sometimes!) Neurodivergence is anything that affects your brain.
“Neurodivergent people hate loud noises” is actually just as valid as a statement as “neurodivergent people have delusions,” “neurodivergent people have tics,” or even “neurodivergent people have low empathy.”
#neurodivergent#aspd safe#npd safe#bpd safe#personality disorders#cluster b#cluster b safe#cluster c#cluster a#dissociative disorders are neurodivergencies#dissociative#osddid#did#osdd#tourettes#tic disorders are neurodivergencies#tics#bipolar disorder#substance abuse disorder
13K notes
·
View notes
Text
Machine Learning in Finance: Opportunities and Challenges
(Images made by author with MS Bing Image Creator )
Machine learning (ML), a branch of artificial intelligence (AI), is reshaping the finance industry, empowering investment professionals to unlock hidden insights, improve trading processes, and optimize portfolios. While ML holds great promise for revolutionizing decision-making, it presents challenges as well.
This post explores current…

View On WordPress
#clustering#Finance#financial data analysis#kkn#machine learning#ml algorithms#nlp#overfitting#pca#portfolio optimization#random forests#svm
0 notes
Text
youtube
Session 13 : What and Why Unsupervised ML: Clustering & Dimension Reduction Basics
Join us for Session 13 as we delve into the fundamentals of Unsupervised Machine Learning. Discover the 'What' and 'Why' behind Clustering and Dimension Reduction. Explore the core concepts and gain insights into the crucial role these techniques play in uncovering patterns and structures within data. Whether you're a beginner or looking to reinforce your understanding, this session is your gateway to unlocking the basics of Clustering and Dimension Reduction in Unsupervised ML.
youtube
Subscribe to "Learn And Grow Community"
Follow #LearnAndGrowCommunity
#unsupervisedlearning#MachineLearningBasics#Clustering#DimensionReduction#DataScience#machinelearning#ai#artificialintelligence#mlexplained#mlforbeginners#AIInsights#AutonomousLearning#MLExplained#PatternRecognition#Session13#DataAnalysis#TechEducation#BeginnersGuide#AI#ML#TechExploration#Youtube
1 note
·
View note
Text
*displays textbook symptomatic behavior of my own disorder that I am well educated on* what’s my deal why am I like this
#I know exactly why I’m like this but why am I like this#I know what’s wrong with me but wtf is wrong with me#adhd autistic#audhd creature#cluster a#cluster b#cluster c#personality disorders#bpd stuff#late diagnosed autistic#cptsd recovery#did osdd#bpd#audhd#adhd problems#audhd problems#borderline personality disorder#complex trauma#mood disorders#anxiety disorders#psychotic disorders#neurological disability#neurodivergent#neurodiversity#trauma disorders#traumagenic
11K notes
·
View notes
Last Seen Blogs

hkaitsi
Dariplw

pit-angel
The One and Only!

batam-bekas-blog
Untitled


quite-vexing-blog
You Don't Own Me